• Skip to primary navigation
  • Skip to main content
  • Skip to primary sidebar

Tyler Barron

  • Home
  • Around My Home Project 2-4
    • Story
    • Context and Social Media
    • Climate and renewable energy
  • Around the Campus Projects 5-8
    • Location and team
    • Microclimate
    • Walkability
    • Ecosystem services
  • Site Suitability Projects 9-14
    • Geoplanner 1
    • Geoplanner 2
    • Geoplanner 3
    • Geoplanner 4 – Story Map
  • Final Project
  • About

Location and team

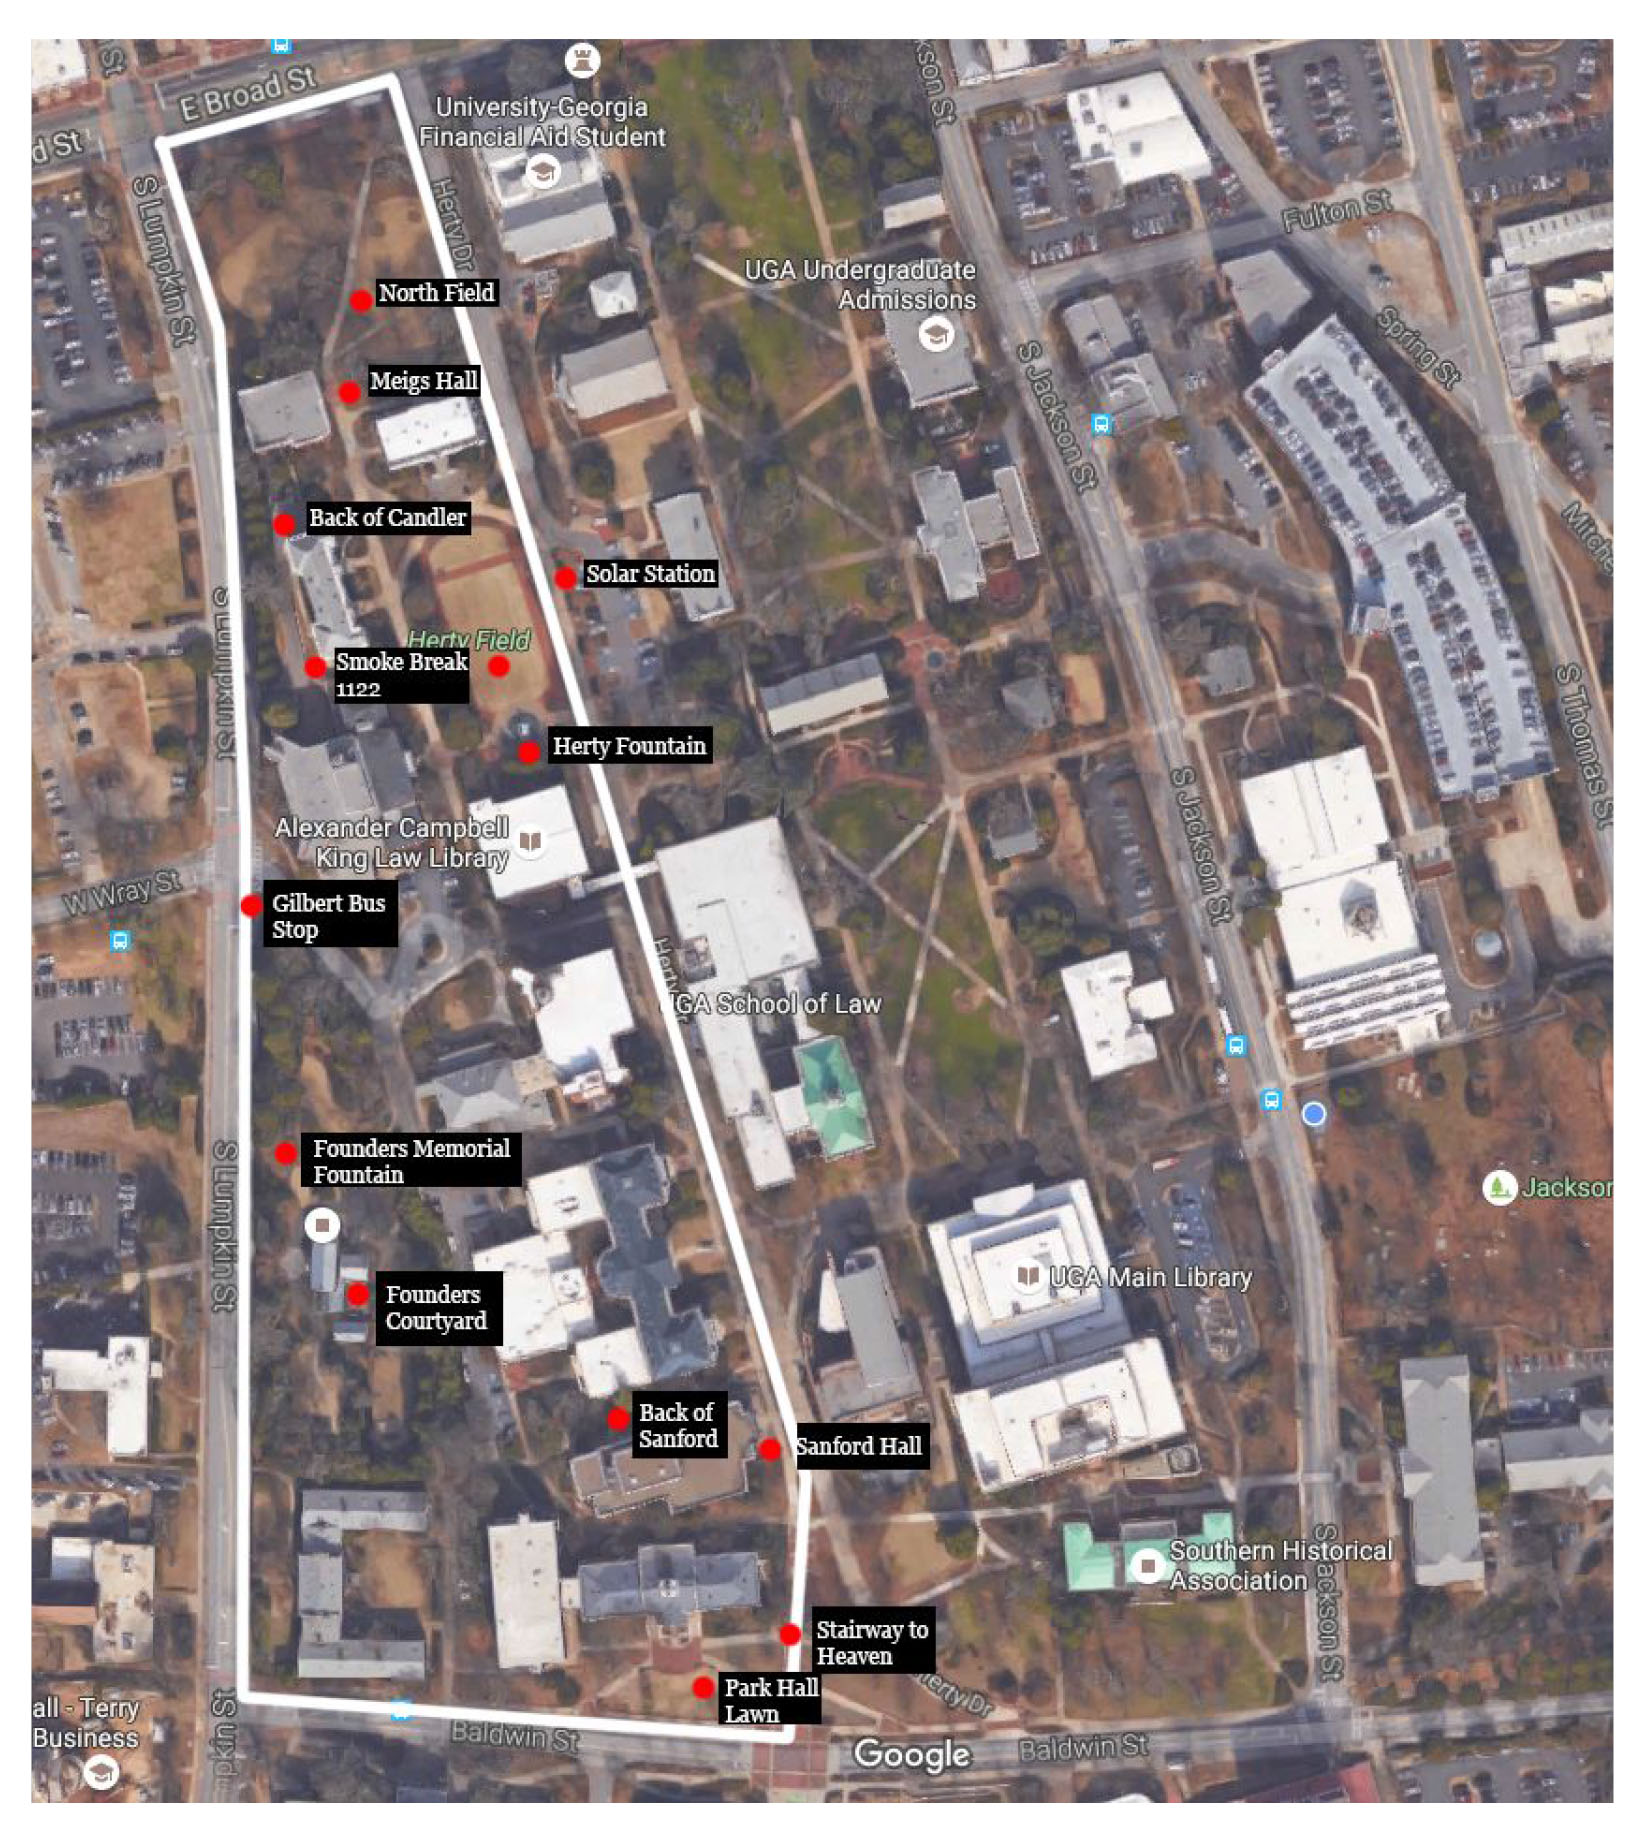
The area surveyed, shown below, is bound by a white line and shows the individual areas of study with red dots. It is a section of UGA’s North Campus between Lumpkin Street and Herty Drive. Below that photo is a picture of the crack team of experts, Group One, who ventured the local area to collect data on the site. The data collected consisted of: ambient temperature, humidity, wind speed, and tree sizes.

campus-walk-map group-1-group-photos

Primary Sidebar

Pages

  • About
  • Around My Home Project 2-4
    • Climate and renewable energy
    • Context and Social Media
    • Story
  • Around the Campus Projects 5-8
    • Ecosystem services
    • Location and team
    • Walkability
  • Blog
  • Final Project
  • Microclimate
  • Site Suitability Projects 9-14
    • Geoplanner 1
    • Geoplanner 2
    • Geoplanner 3
    • Geoplanner 4 – Story Map
  • Welcome
July 2025
M T W T F S S
 123456
78910111213
14151617181920
21222324252627
28293031  
« Mar