• Skip to primary navigation
  • Skip to main content
  • Skip to primary sidebar

Tyler Barron

  • Home
  • Around My Home Project 2-4
    • Story
    • Context and Social Media
    • Climate and renewable energy
  • Around the Campus Projects 5-8
    • Location and team
    • Microclimate
    • Walkability
    • Ecosystem services
  • Site Suitability Projects 9-14
    • Geoplanner 1
    • Geoplanner 2
    • Geoplanner 3
    • Geoplanner 4 – Story Map
  • Final Project
  • About

Microclimate

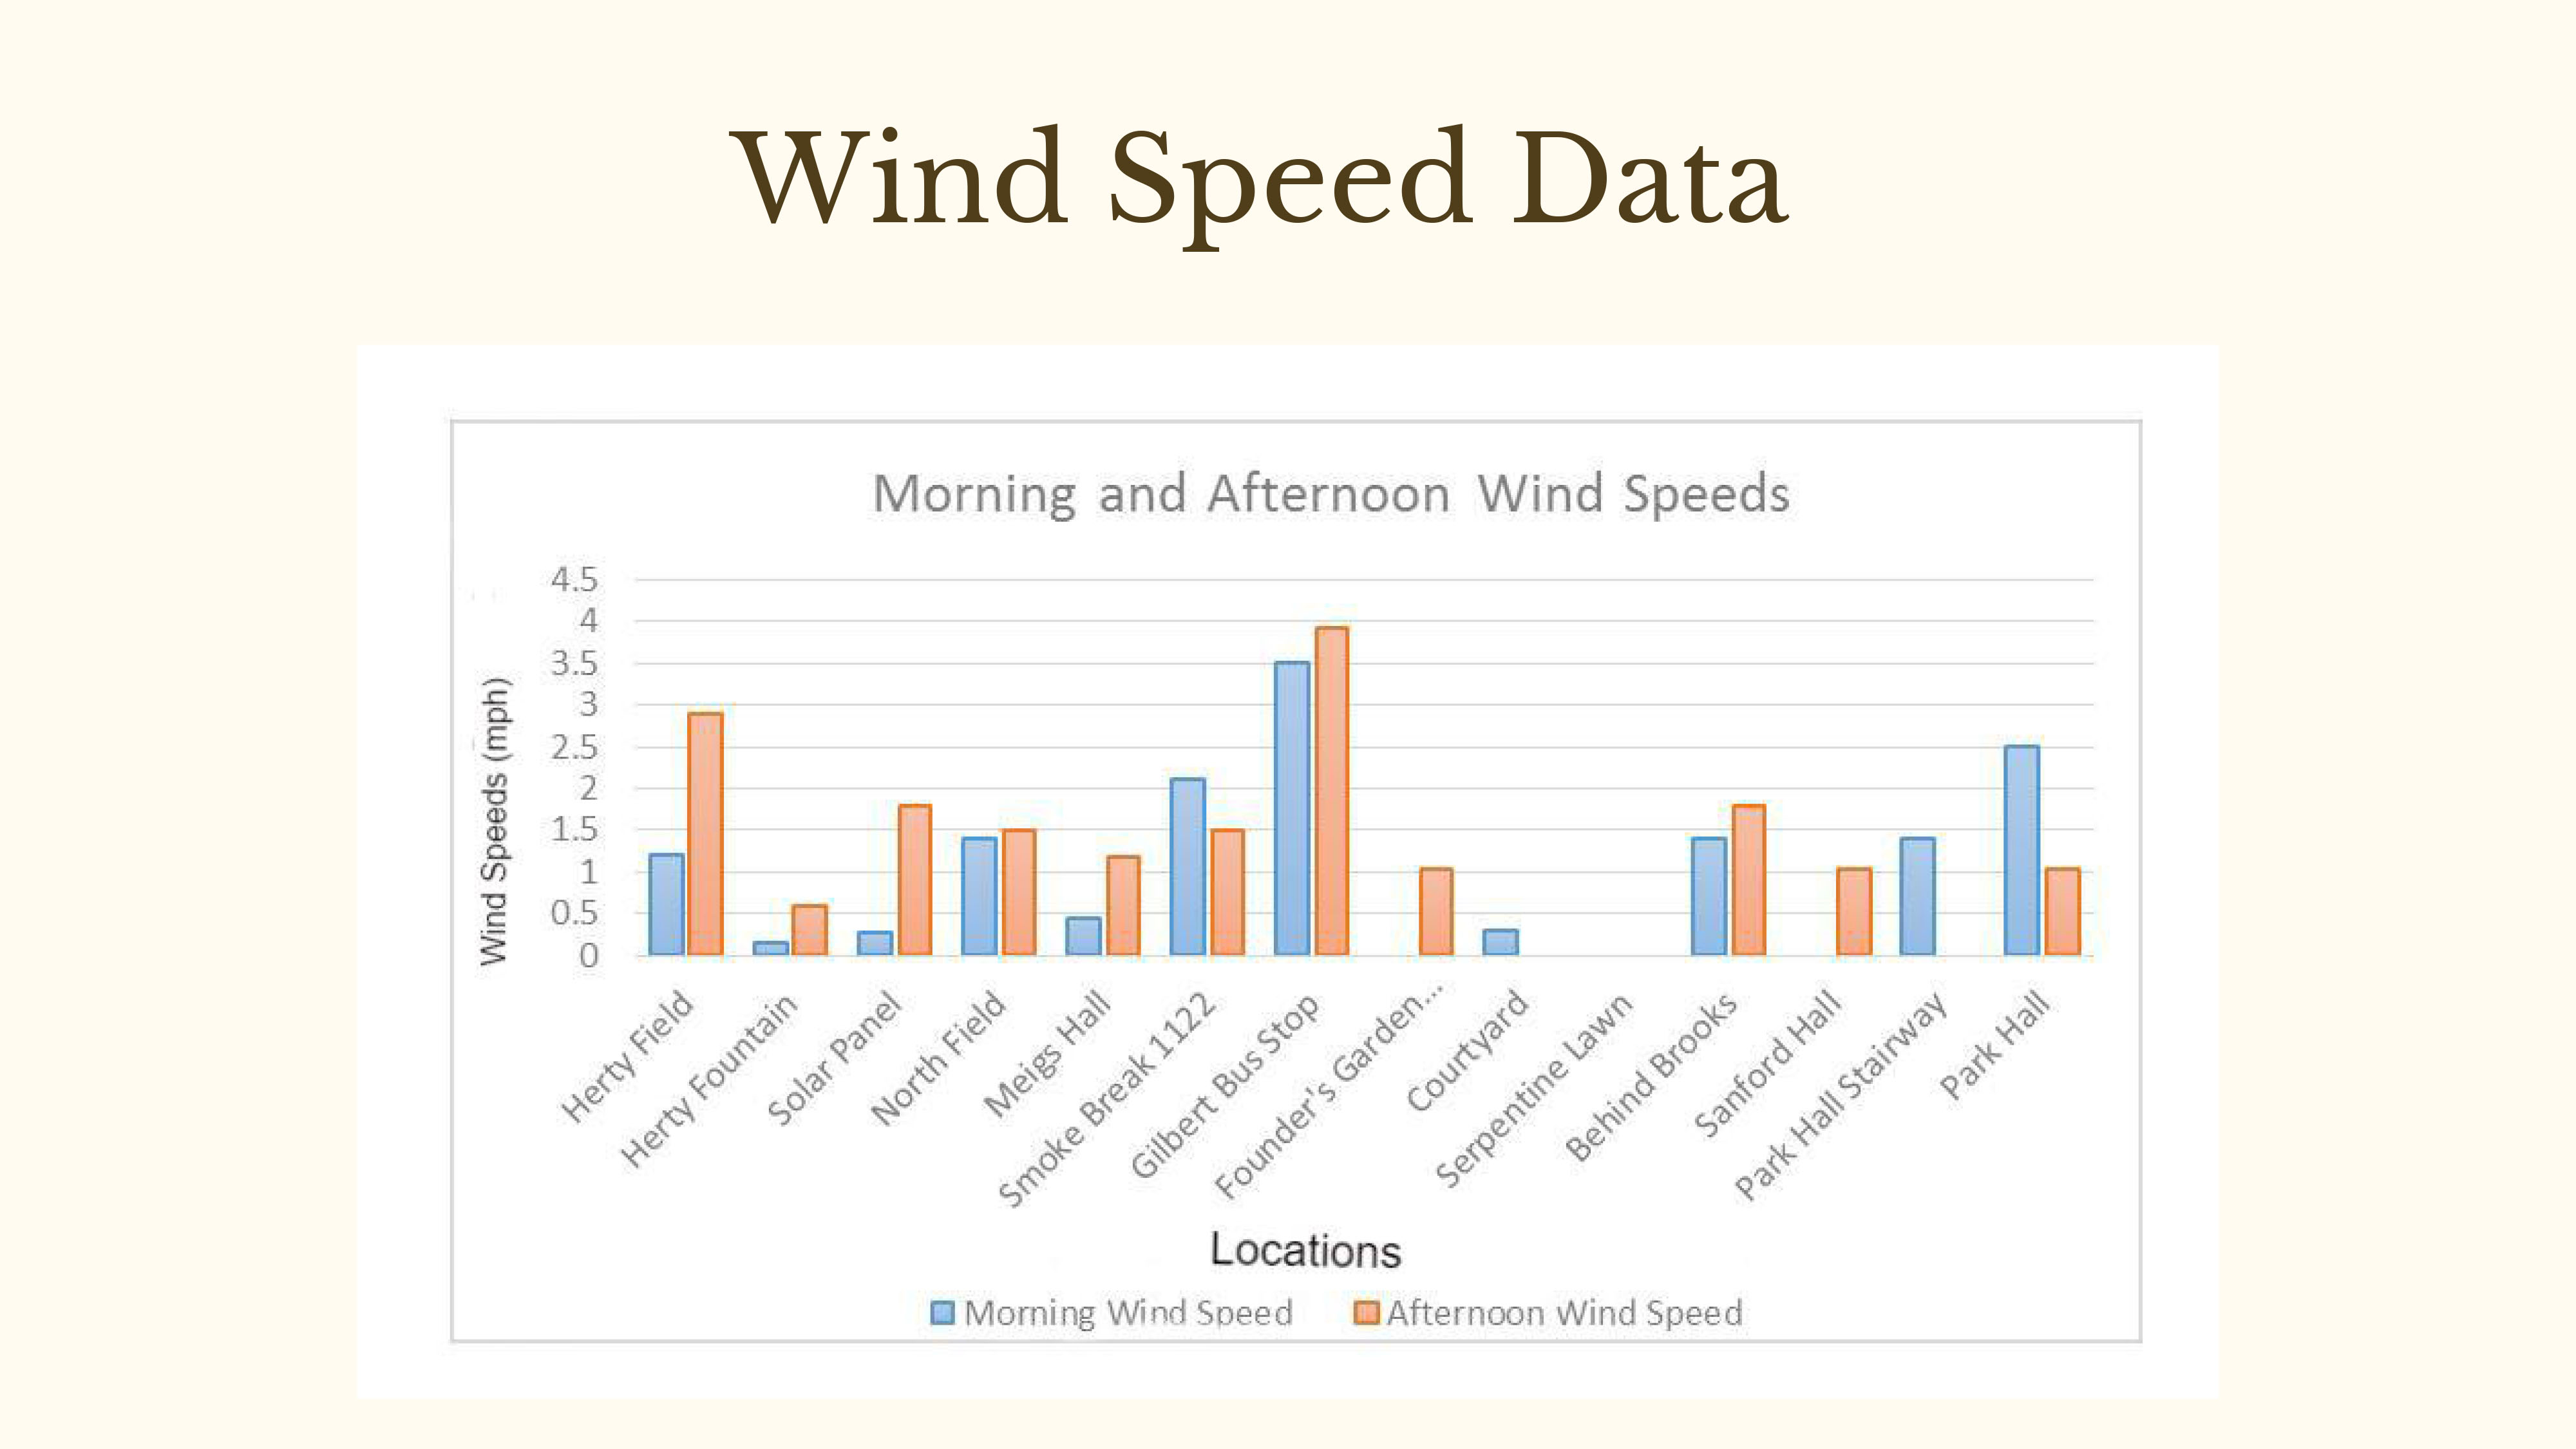
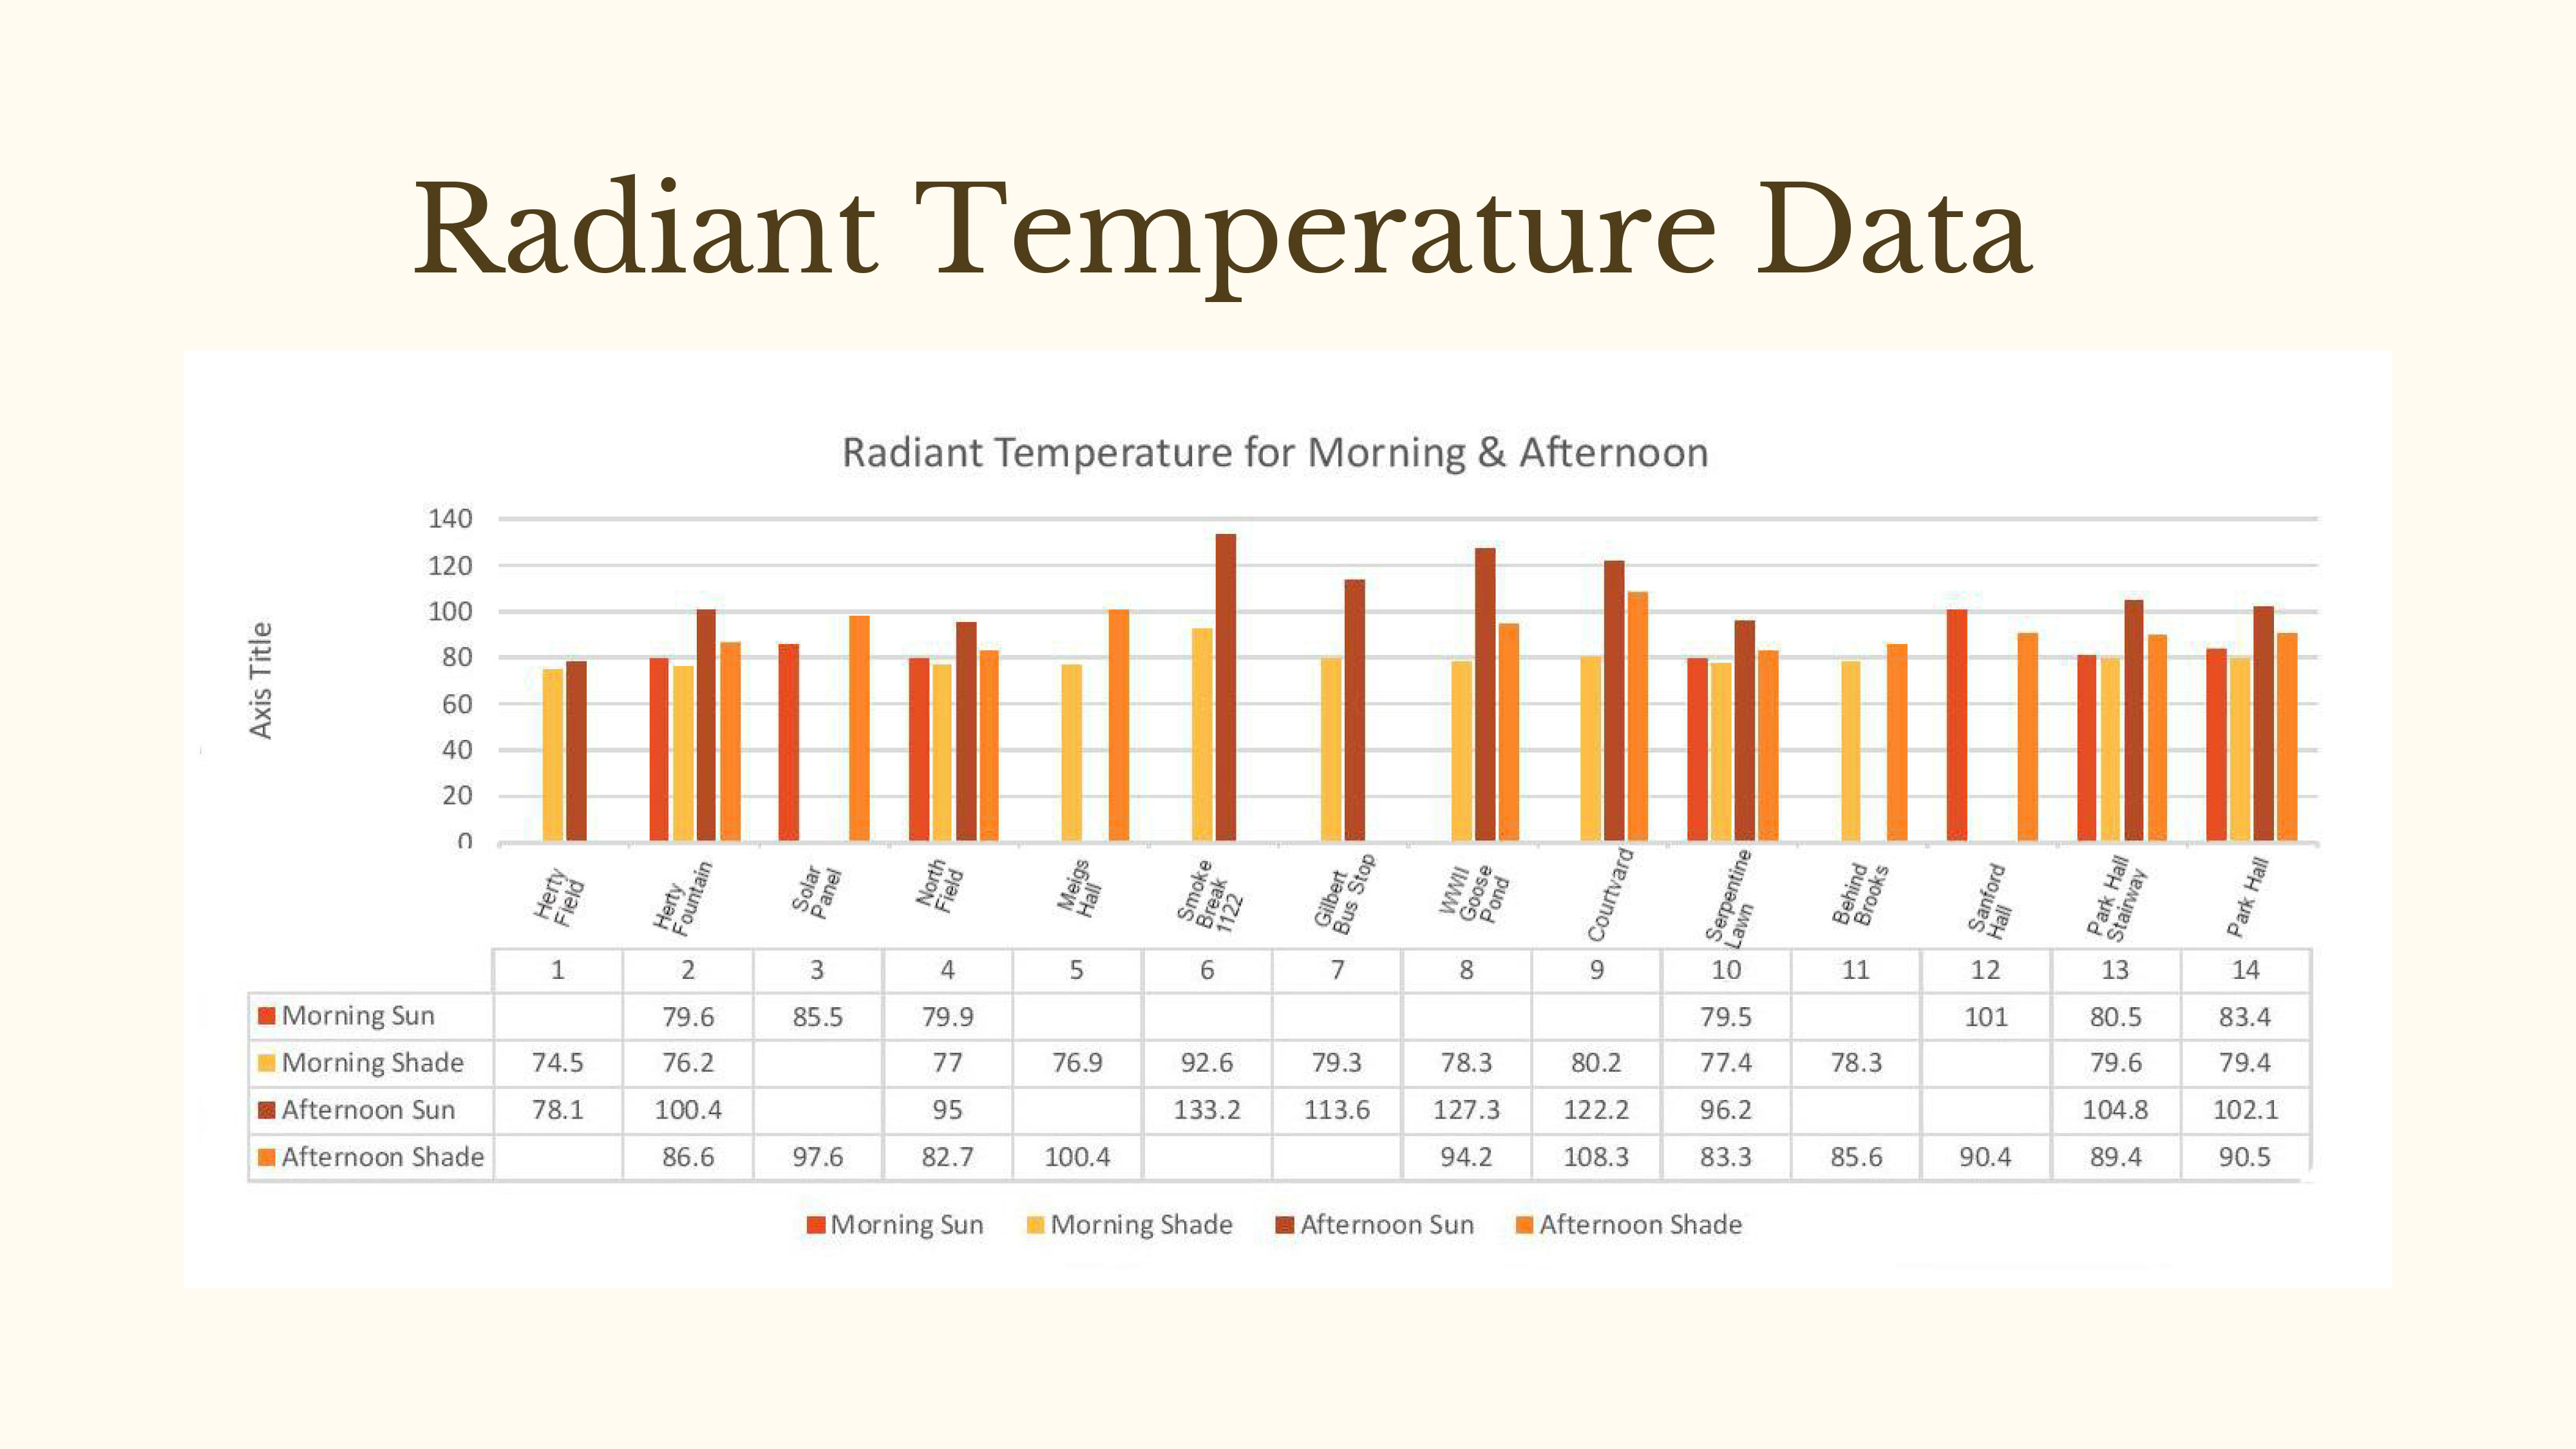
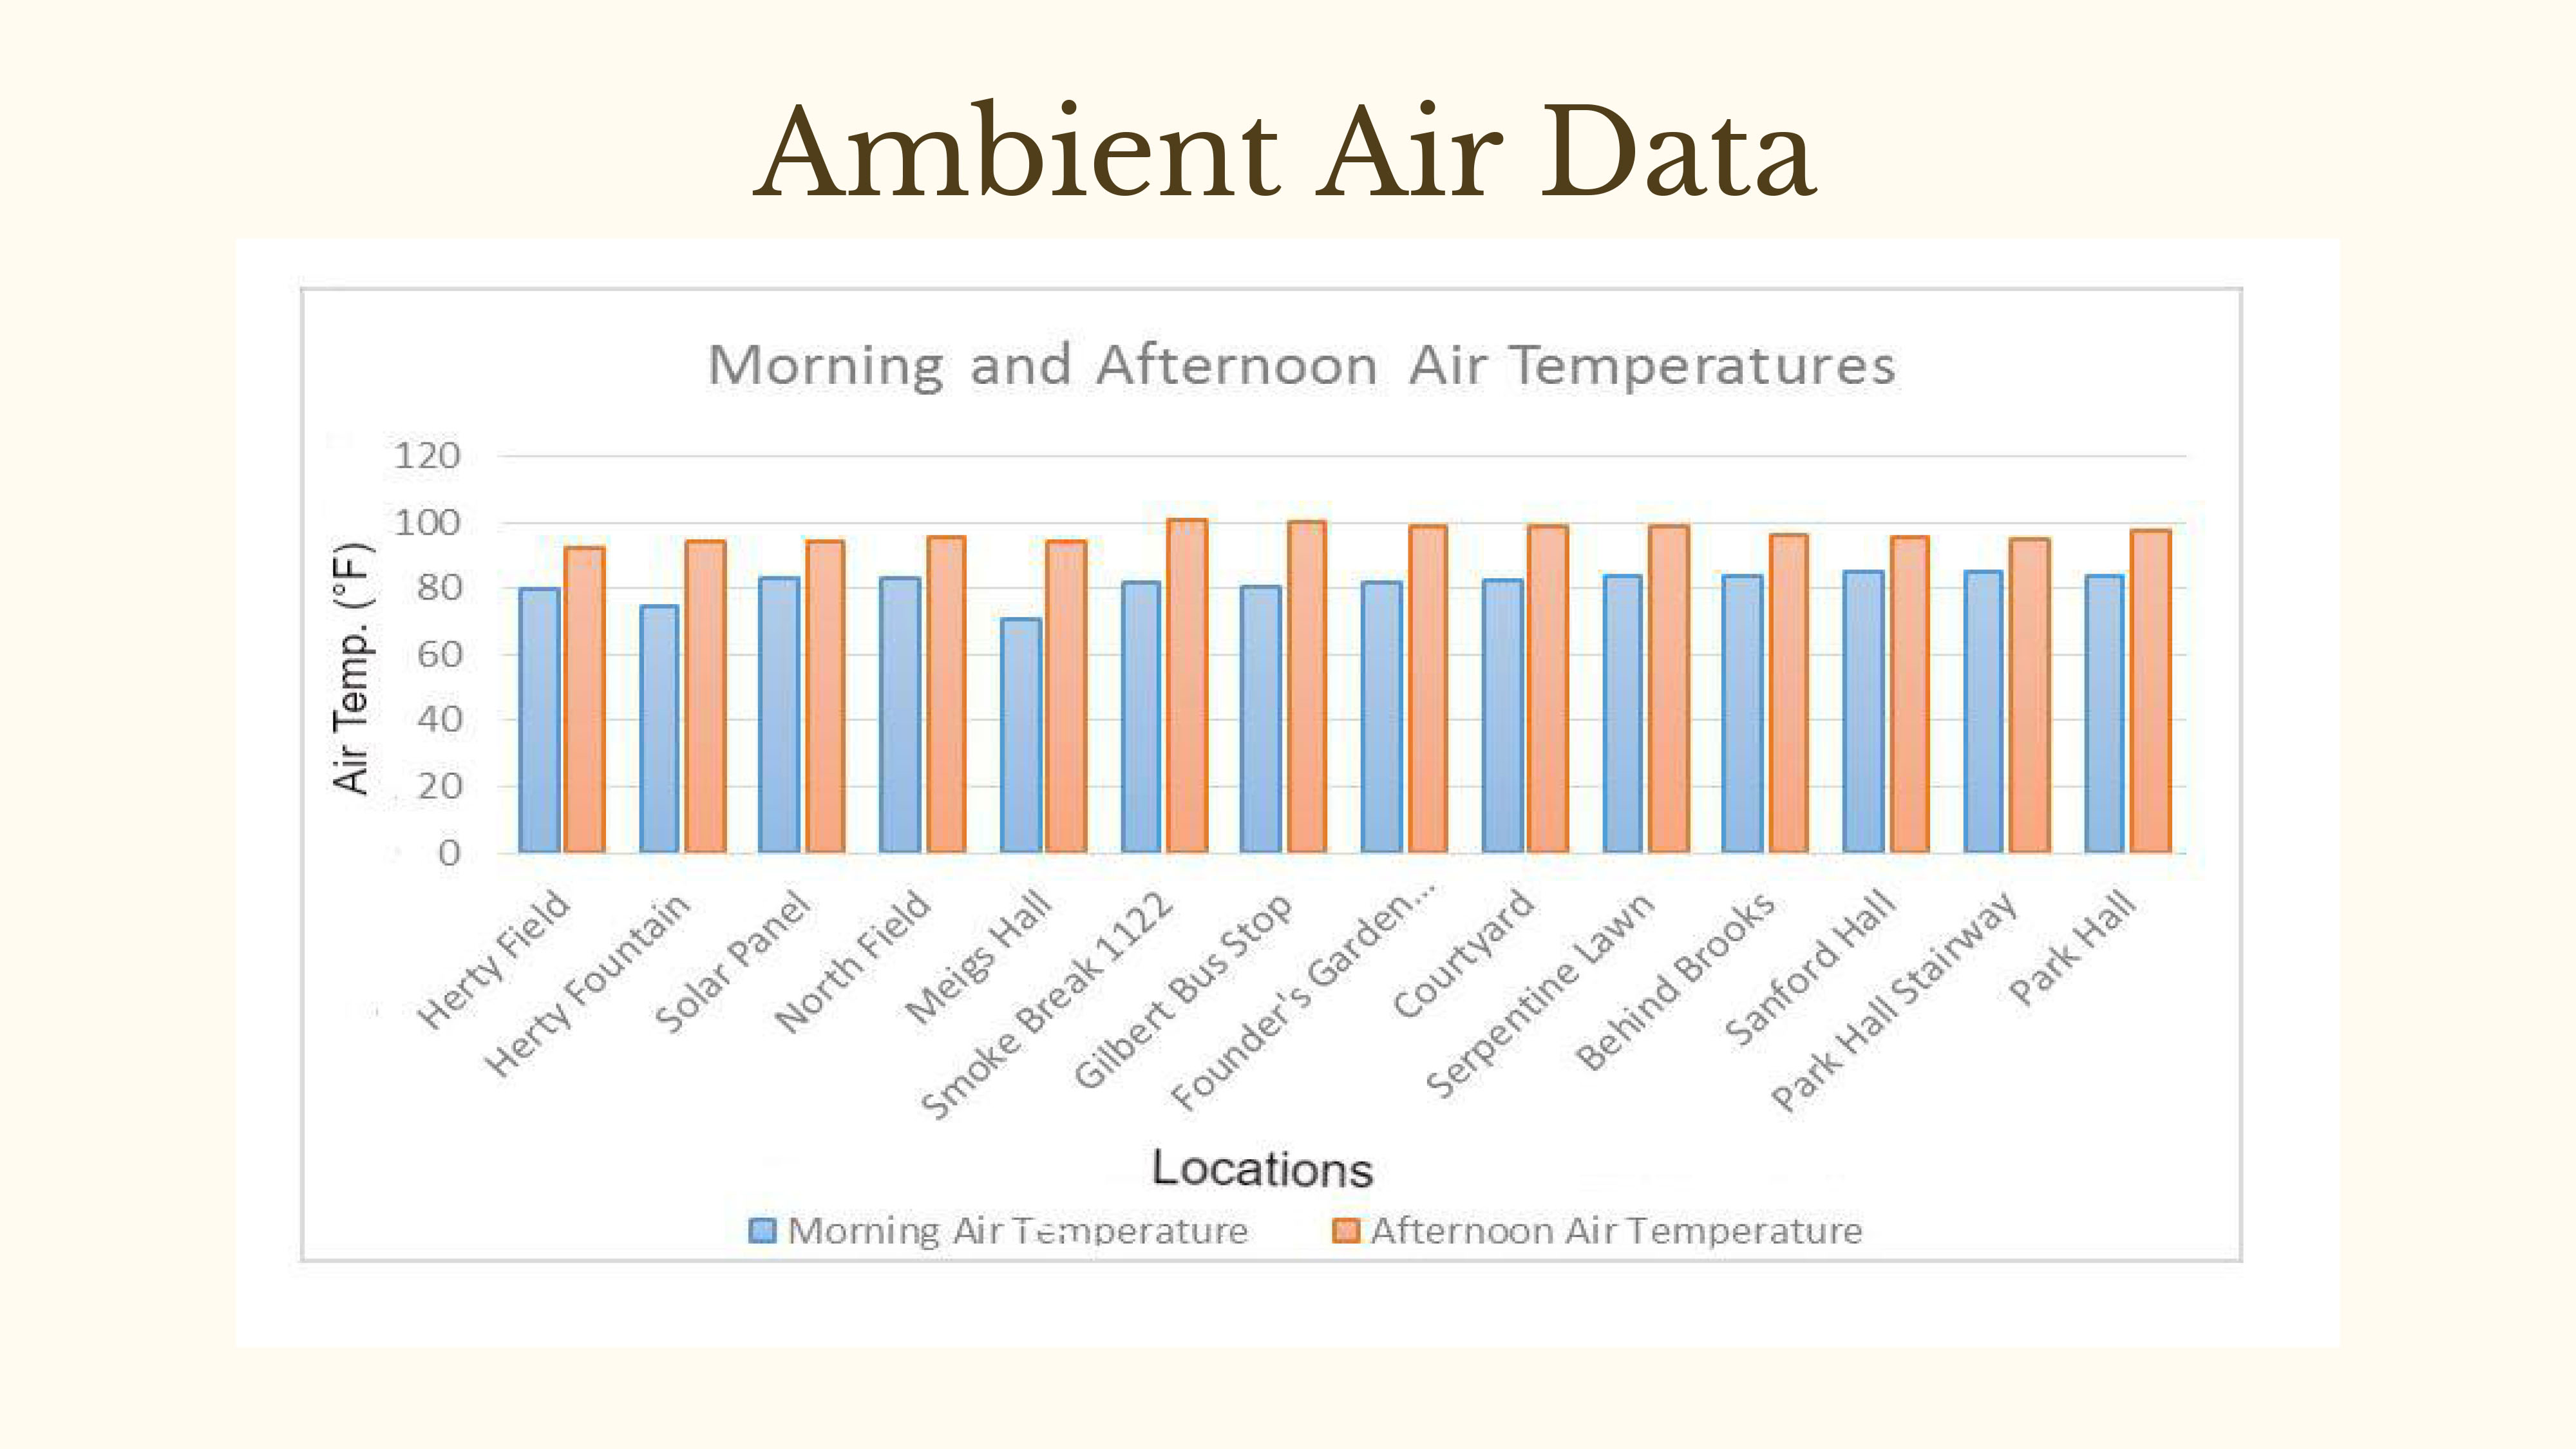
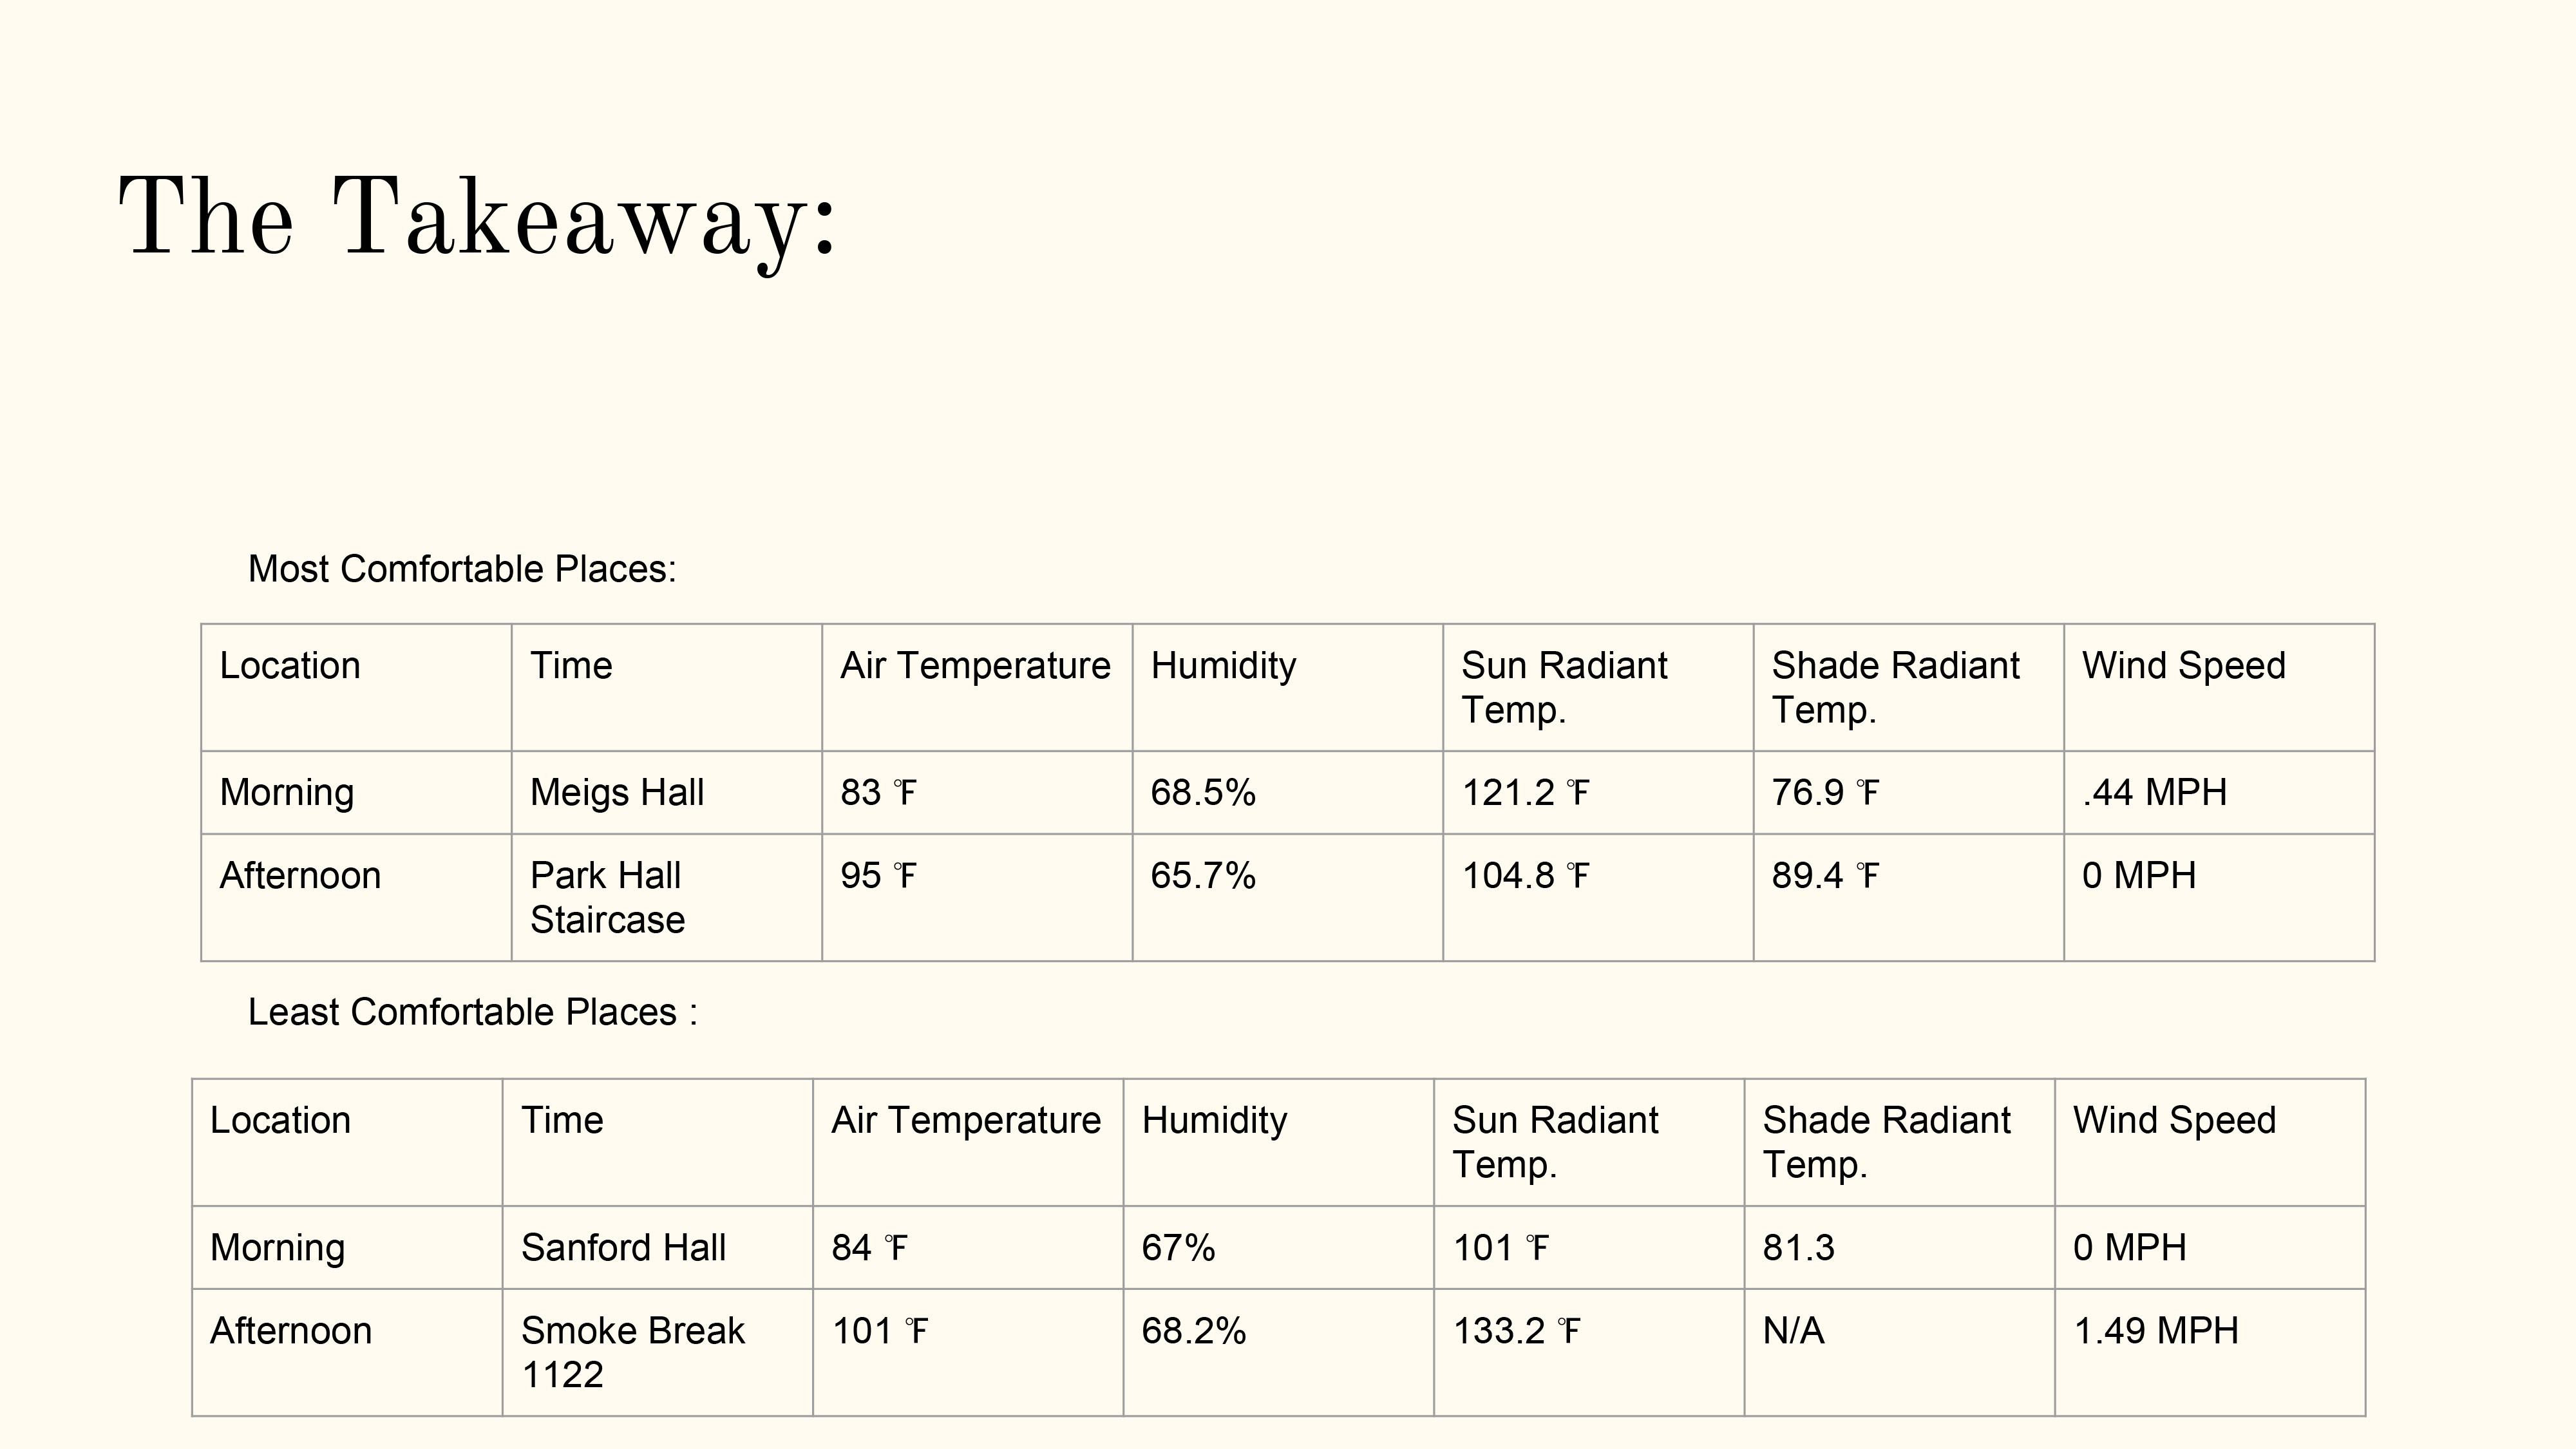
Below are graphs showing data from the various sites within our surveyed area. Overall, each site’s individual comfort level was defined by trees, architecture, and orientation to the sun, with the latter being the most important. Trees, although able to provide shade, also provide wind break, which can take away from the comfort of a site. In a way, the conclusion shows how design should start the ground up, taking into account building orientation and the definition of space through architecture, before attempting to mediate an issue through placement of trees or other amenities.

wind-data
The day we went out for an afternoon analysis was windier than the morning analysis. However, this does not discount the data when looked at as a general summary of which areas had more wind. Wind speed as highest at areas with a low number of trees. This is a result of trees serving as windbreaks. Gilbert Hall’s bus stop seemed to have high even high wind speeds due to the traffic passing by on Lumpkin St.
temp-data
The highest temperatures were most obviously a result a sun exposure but were also generated by the time of day at which these temperatures were taken. The highest variation in temperature during morning and afternoon were at the location dubbed Smoke Break, a cigarette littered area behind the international affairs building on North Campus, and the Gilbert Hall bus stop. Both these sites had large structures, be it buildings or trees, on the east side to protect from the morning sun but were exposed on the west. This western exposure placed the areas under a full blast of oppressing heat from afternoon sun.
air-data
Ambient air temperature is perhaps the most consistent data collected during the microclimate study. Air is a fluid substance which will actively transfer kinetic energy, otherwise known as heat, across its entirety. This creates a minute variation in temperatures as the air is ever presently attempting to distribute the heat evenly across the area.
walkability-conclusion
Conclusion: This group was arguably blessed with a more walkable portion of North Campus. Although it was a hot summer’s day, there were sidewalks everywhere and many trees to shade the walk. The group had the opportunity to appreciate lawns on the Founder’s Garden, Herty Field, and the corner of Lumpkin and Broad. The trees were large and shrubs were plenty. For a summer’s day in Georgia, the area felt remarkable tolerable.

canopy-data

Primary Sidebar

Pages

  • About
  • Around My Home Project 2-4
    • Climate and renewable energy
    • Context and Social Media
    • Story
  • Around the Campus Projects 5-8
    • Ecosystem services
    • Location and team
    • Walkability
  • Blog
  • Final Project
  • Microclimate
  • Site Suitability Projects 9-14
    • Geoplanner 1
    • Geoplanner 2
    • Geoplanner 3
    • Geoplanner 4 – Story Map
  • Welcome
July 2025
M T W T F S S
 123456
78910111213
14151617181920
21222324252627
28293031  
« Mar