

Analysis
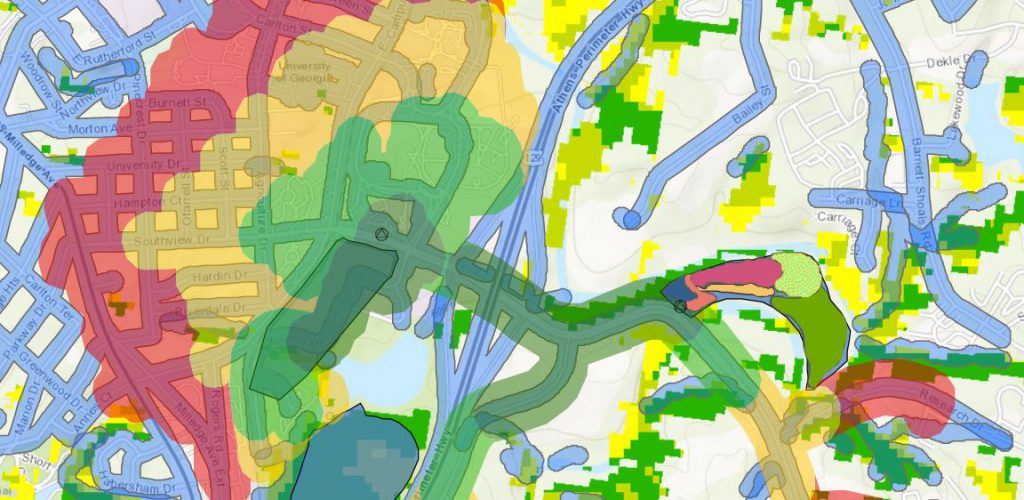
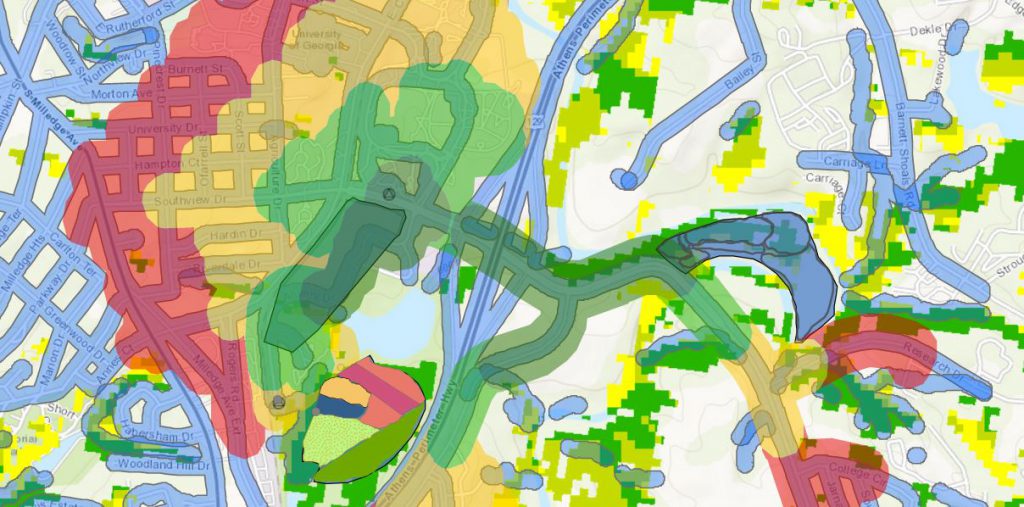
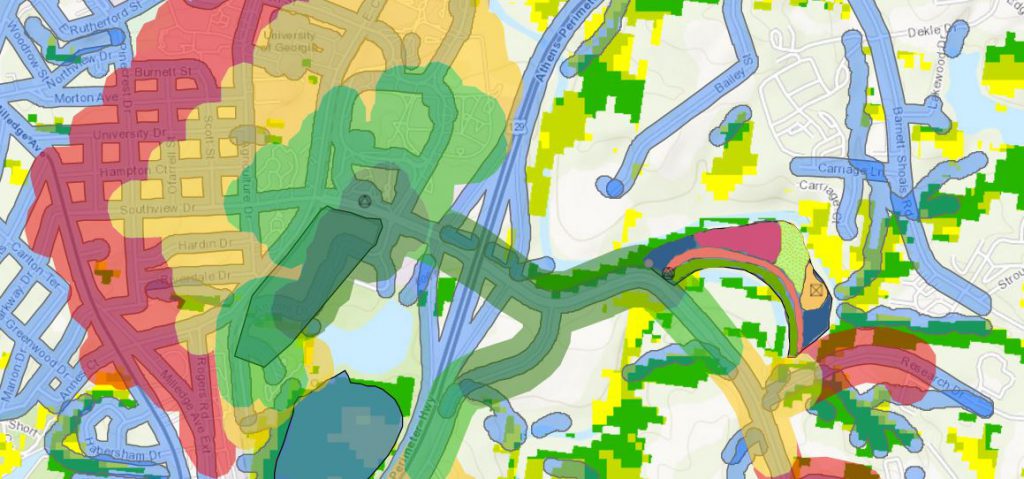
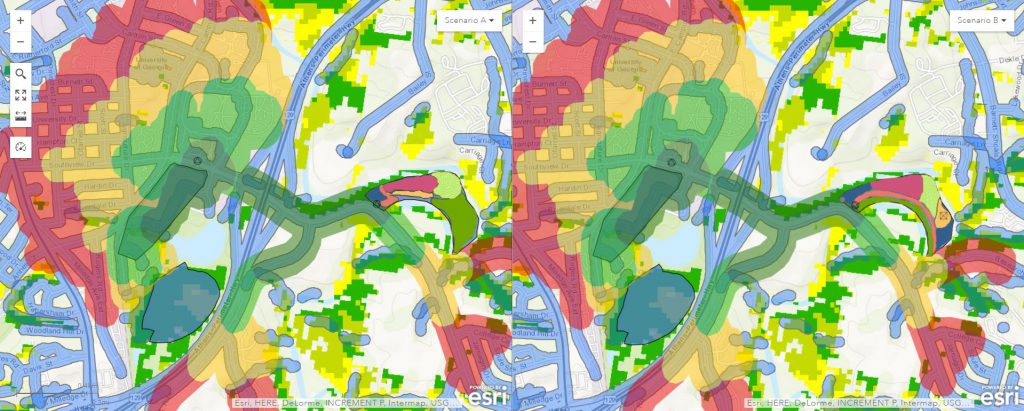
The areas extending from the circumscribed triangles show transit stops with the green to yellow to red blooms displaying walkability factor of young adults from these locations. Although the layer directly correlates with walk times, they can be interpreted as how likely it is that an individual would be willing to walk a distance to or from the transit stops. For walkability to be a major factor, any of these scenarios could work as they are along a major vehicular corridor for public transit or directly walkable. An additional iteration of Scenario A was done for Scenario C as to provide a more unified placement of land use. Scenario C catered to the balance of vehicles and walkability as the public transit system in Athens runs regularly along the College Station corridor. This would allow for more visitors to the farm, not just those travelling by foot.

