Author: das55839

Better Transit, Better Mental Health?

A City Lab article, “Living Near A Transit Line Might be Good for your Mental Health,” talks about the effect that living near a transit line has for the mental health of senior citizens. According to this article, access to public transit will have beneficial effects towards mental health in older populations.  This was based on a 2015 study published in the International Journal of Environmental Research and Public Health that looks at the effect of the built environment on the mental health of its residents across age groups in Turin, Italy. They measured the mental health outcomes based on the incidence rate ratio of the use of anti-depressants across socio-economic variables and built environment measures.

Both the article and the paper mention that density and access to public transit had a positive effect on mental health especially for older women (Jaffe 2015; Melis et al., 2015). The article also says that the older populations were prescribed fewer anti-depressants when living near public transit or in areas with a higher population density. However, looking at the actual statistics and comparing to the male population, this might be a slight exaggeration.  When looking at close proximity to public transit, the incidence rate ratios for prescription medications for women are all statistically significant, but the protective impact decreases in higher age groups; from the 20 to 34 years age group there was only a 6% reduction in risk in being prescribed anti-depressants and this went down to a 5% reduction risk in the 35 and up age groups. Compared to the women, men in the 50-64 years age group who lived near public transit had a 6-7% reduced risk in being described anti-depressants and a 7% reduced risk when living in a densely populated area.

The article and paper both were transparent in mentioning the limitations of the study. The article actually mentioned a NIH study which showed that living near public transit actually increased the risk for symptoms of depression among youth in Boston (Jaffe, 2015; Duncan et. Al, 2013). In addition, tracking the use of antidepressants does not fully encompass those who suffer from depression (Jaffe, 2015; Melis et al., 2015).

That being said, there still was a reduced risk in the prescribing of anti-depressants across older populations which indicates that proximity to public transit could have a positive effect on one’s mental health. A health practitioner could find this policy useful when getting involved in transportation policy. Health practitioners can inform city planners of the positive effect of public transportation on the mental health of senior citizens and advocate for more transportation services in areas that have a significant elderly population.  In addition, for an area with a more established public transportation network, practitioners could advocate for more paratransit services which will increase accessibility for older people with disabilities. While this study does have some limitations, it is the first of its kind that explored the link between various elements of the built environment and mental health.

SOURCES
Duncan, D. T., Piras, G., Dunn, E. C., Johnson, R. M., Melly, S. J., & Molnar, B. E. (2013). The built environment and depressive symptoms among urban youth: A spatial regression study. Spatial and Spatio-Temporal Epidemiology, 5, 11–25.

Jaffe, E. (1, Dec 2015). Living Near a Transit Line Might Be Good for Your Mental Health.  City Lab.
Retrieved from http://www.citylab.com/commute/2015/12/study-transit-density-mental-health-depression-turin/417969/

Melis, G., Gelormino, E., Marra, G., Ferracin, E., & Costa, G. (2015). The Effects of the Urban Built Environment on Mental Health: A Cohort Study in a Large Northern Italian City. International Journal of Environmental Research and Public Health, 12(12), 14898–14915.
torino

Soda Taxes: What’s the Verdict?

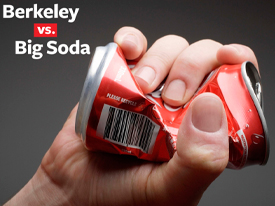
Do ‘soda taxes’ curb consumption of sugar-sweetened beverages? According to the LA Times article, “Berkeley sees a big drop in soda consumption after penny-per-ounce ‘soda tax,’ this seems to be the case. The article mentions a recent study published in the American Journal of Public Health (AJPH) concerning the consumption patterns of residents in Berkeley five months after the tax was implemented. According to Falbe et al. (2016), lower-income residents in Berkeley reduced their intake of sugar-sweetened beverages by 21% and increased their water consumption by 63% (Kaplan, 2016). Interestingly enough, the neighboring cities actually experienced an increase in consumption of sugar-sweetened beverages and only a 19% increase in water consumption (Kaplan, 2016). While these are promising results, does this mean that a soda-tax will be just as successful in other places as well?

The LA Times article echoes a lot of what the AJPH article says and makes a lukewarm endorsement of ‘soda taxes’ at the most.  Both the LA Times article and the AJPH article both state that it is unknown that such a tax would work in other cities since the study was only done in one city. It would be erroneous to state that what will work in Berkeley, a city with a population of 120,927 will work in a city like Washington D.C., with a population of around 672,228 (U.S. Census Bureau, 2015). Another thing to take in consideration is the presently held health beliefs before the implementation of the tax. The AJPH article mentioned that the significant decrease in sugar-sweetened beverages could have also been due to Berkeley being a health conscious city. In addition, there was wide community support of these initiatives.  In addition, Berkeley has relatively higher median income compared to it’s neighbors. How would these policy affect cities with much lower median incomes? It could have detrimental effects, especially in places which are food insecure.  The APJH article was quite transparent in realizing the limitations of the study and called for longer-term studies.

While this is a short-term study, health practitioners, especially those who work in health policy and community health, can find some takeaways from these studies. As mentioned previously, it is integral to garner community support on the implementation of a ‘soda tax.’ There could be opposition to this measure by community members for some might see it as an infringement on their freedoms and punishing them for the choices they have. In other words, there would be a mismatch between policy and community concerns.  Secondly, health practitioners in these areas could see that in order to gain support for these measures, one must be already be health conscious. Before even proposing this tax, practitioners should set the groundwork in creating community-wide programs which gets people thinking about their health.

berkeleyvsbigsoda

SOURCES
Falbe, J., Thompson, H., Becker, C., Rojas, N., McCulloch, C., & Madsen, K. (2016).  Impact of the Berkley Excise Tax  on Sugar-Sweetened Beverage
Consumption. American Journal of Public Health, 106(10), 1865-1871.

Kaplan, K (23 August 2016). Berkeley sees big drop in soda consumption after penny-per-ounce ‘soda tax.’ LA Times. Retrieved from
http://www.latimes.com/science/sciencenow/la-sci-sn-soda-tax-works-20160823-snap-story.html

U.S. Census Bureau (2015).  Quickfacts. Retrieved from http://www.census.gov/quickfacts/table/PST045215/11,0606000,00.

Meditation: It Does A Gut Good?

Can one meditate their GI symptoms away? In August 2015, Collective Evolution published an article which was titled “Harvard Study Reveals What Meditation Does to Gastrointestinal (Bowel) Disorders.”  According to the article, in a study that was published in PLOS One, researchers found that the relaxation response, which is described as a “physical state of deep rest that changes the physical and emotional responses to stress,”(Benson, n.d.) decreases inflammation of suffers of irritable bowel disease (IBS) and inflammatory bowel disease (IBD). Taking a look at the actual study, it does show that engaging in Relaxation Response-Mind Body Interventions (RR-MBI) does have a significant positive effect on decreasing pain and quality of life for the study participants.
While the article produces much excitement and potential about the use of RR-MBI in managing symptoms of chronic illnesses, the research design of the study is weak. The fact that it was not randomized means that the study could have a high amount of bias as a result. It was an uncontrolled study, so we cannot clearly see how much of a difference RR-MBI had in groups who received the intervention and groups who didn’t receive the intervention. Even the researchers admitted that because the study isn’t randomized, they cannot determine if the reported changes had to do with RR-MBI (Kuo et al., 2015).  We can only compare across those who have IBS and those who have IBD. In addition, the number of participants was small(only 48), mostly white (95%) and female (67%) (Kuo et al., 2015). Because of this, it would be an overgeneralization to say that meditation will benefit all sufferers of IBS and IBD.
The article was erroneous in saying that it was an eight-week study; it was actually a nine-week study.  Given the study was rather short, it can only be suggested that RR-MBI had a positive effect on decreasing pain and increasing quality of life. However, this was more the case for IBD patients than IBS patients during the follow-up period. Studies over a longer time period need to be done to see if there are any definitive long-term effects for both groups. That being said, this was the first study done of its kind and the results elicits the need for further studies.
While this was a short-term study with research design flaws, practitioners still can find this information useful for IBS or IBD patients who suffer from inflammation. Not all patients who suffer from IBS or IBD are keen on merely depending on medication to manage their symptoms. Practitioners could suggest RR-MBI techniques to those patients in helping mitigate their symptoms, but if they do so, it is recommended that they have the patient create a log in which they record their pain level, RR-MBI activities, and prescription use for pain management along with scheduling a follow up appointment to properly see if this intervention is actually effective.

meditationgiphy
SOURCES
Benson, H. (n.d.). RelaxationResponse.org. Retrieved from http://www.relaxationresponse.org.

Kuo B., Bhasin, M., Jacquart, J., Scult, M.A., Slipp, L, Riklin, E.I.K., Lepoutre, V.,…Denniger, J., (2015). Genomic and Clinical Effects Associated with a Relaxation Response Mind-Body Intervention in Patients with Irritable Bowel Syndrome and Inflammatory Bowel Disease. PLOS ONE 10(4) 1-26.

Walia, A (5 August 2015). Harvard Study Reveals What Meditation Literally Does to Gastrointestinal (Bowel) Disorders. Collective Evolution. Retrieved from
http://www.collective-evolution.com/2015/08/05/harvard-study-reveals-what-meditation-literally-does-to-gastrointestinal-bowel-disorders/.

Add Some Spice in your Life for Your Life?

In August 2015, The New York Times published an article titled “Eating Spicy Food Linked to a Longer Life.” According to the article, in a study that was published in The BMJ titled “Consumption of spicy foods and total and cause specific mortality: population based cohort study,” researchers concluded that having chili peppers either once a week or once or twice a week reduced mortality risk by 10 percent and consuming spicy food six to seven times a week reduced mortality risk by 14 percent (Bakalar, 2015). Does this mean that spicy food lovers have a much higher chance to live longer than spicy food haters? Not necessarily the case.

Taking a more in-depth look at the study, there seems to be more to the story. When looking at the absolute mortality rates, the difference between the group that ate the spicy foods less than once a week (6.1) and the group that ate spicy foods six or seven days (5.8) a week is quite small compared to the groups that ate spicy foods once or twice a week (4.4) and three to five times a week (4.3) (Jun et al., 2015).  The article merely mentions that the mortality rates for cancer, ischemic heart disease, and respiratory diseases were lower among the group that ate spicy foods six to seven days a week.  Looking at the actual range in which the risk for mortality can lie shows that this is not as black and white. The group who ate spicy food six or seven days a week actually had a zero to 15 percent chance of having a reduced mortality risk due to cancer but did have a 11 to 36 percent  chance of having a reduced mortality risk due to ischemic heart disease and a 19 to 50 percent chance of having a reduced mortality risk of respiratory disease (Jun et al., 2015). These ranges have a 95% confidence interval which means that there is a 95% chance that the actual mortality risk falls within these values.

The article says that the researchers did not draw any conclusions about cause and effect and said there needs to be more evidence.  So while the title says one thing, in the end, the authors do not want us to jump to conclusions. In the actual study, they even mentioned that eating spicy foods might be correlated to other dietary and lifestyle behaviors (Jun, et al., 2015) Those who ate more amounts of spicy foods lived in rural areas and ate more fruit and vegetables. While there needs to be more research regarding the relationship between spicy food consumption and mortality risk, it certainly doesn’t hurt to add a little bit of spice to your life. Practitioners can find this information to be useful when working with patients who are suffering from the diseases mentioned in the study. In making suggestions for changing one diet, practitioners could mention the possible benefit of chili peppers in terms of reducing mortality risk. Patients can have difficulty knowing where to start with making major dietary changes and this information could  be helpful to them.

SOURCES
Bakalar, N. (2015). Eating Spicy Food Linked to a Longer Life. New York Times. Retrieved from

Jun, L., Qi, L., Yu, C., Yang, L., Guo, Y., Chen, Y., Bian, Z.,…Li, L.(2015). Consumption of spicy foods and total and cause specific mortality: population based cohort study. BMJ 351, 1-10.