Design Scenario A
Designing an Interactive Farm
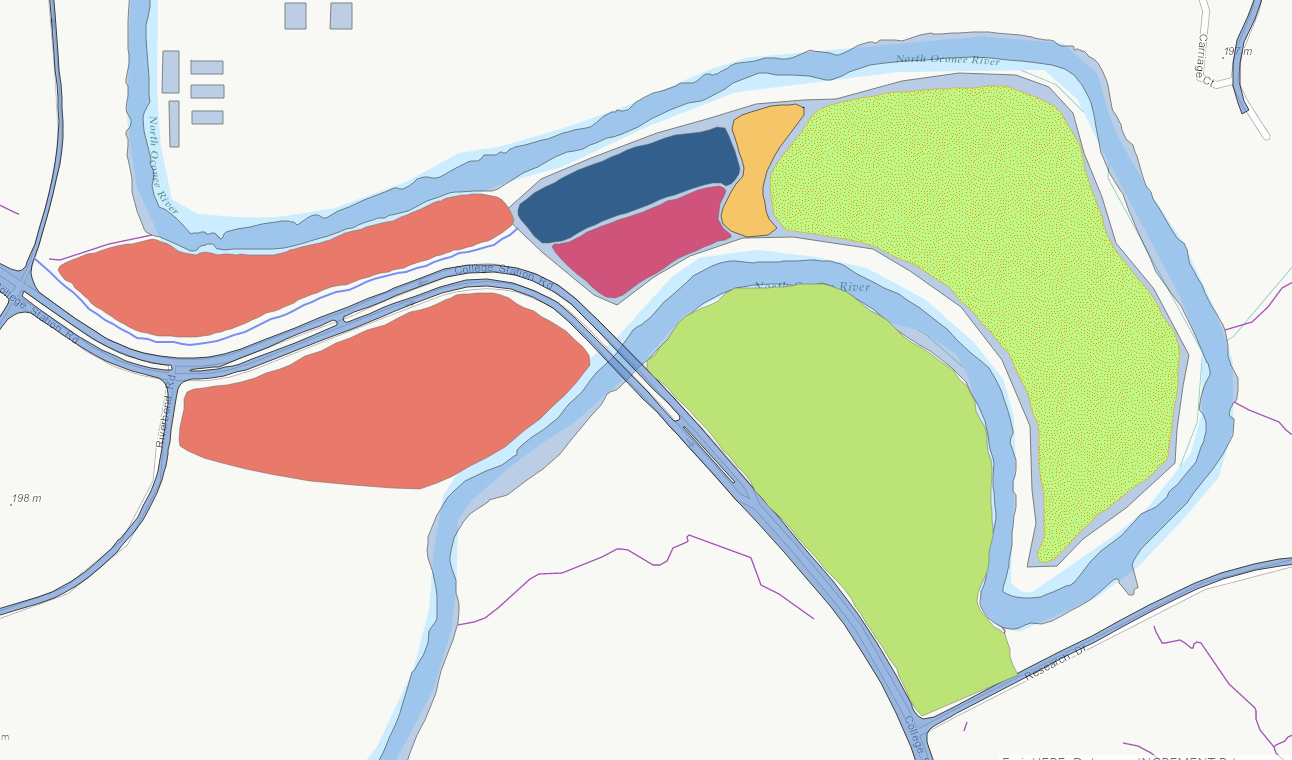
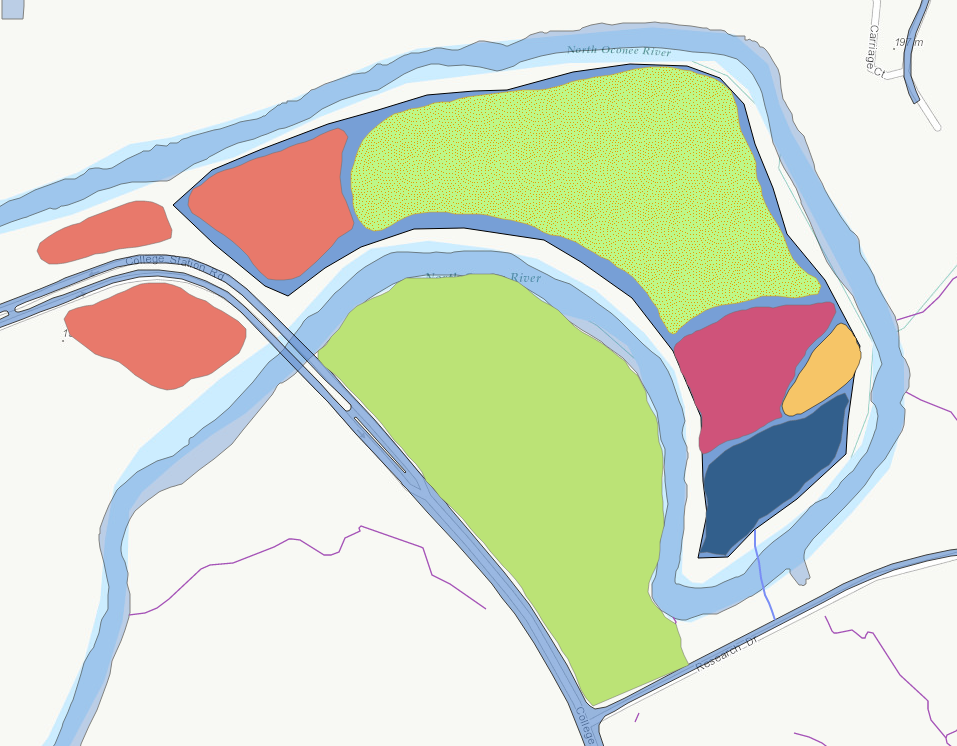
The first site design for my snail farm creates an interactive space that allows for both recreation and commercial activities.
The site is connected to US 129, and visitors come into a parking lot that runs alongside a recreation field and a picnic area. Respectively, parking is represented by the dark blue shape, the picnic area by yellow, and the recreation area by the magenta. These make up the recreational aspect of the site. The snail farm itself is represented by green filled with dots and comprises the large swathe of land in the right-hand part of the site. Located there, it can be both a commercial enterprise and a potential area for education, drawing people in from the recreational areas to learn about snails and snail farming.
To the south of the snail farm and recreation area, denoted by the green shape, is a conservation area that protects the land there and leaves it as is. Finally, the red shapes indicate areas designated for stormwater, and they border the roads and parking lot to handle the changes made to the site.
A Closer Look
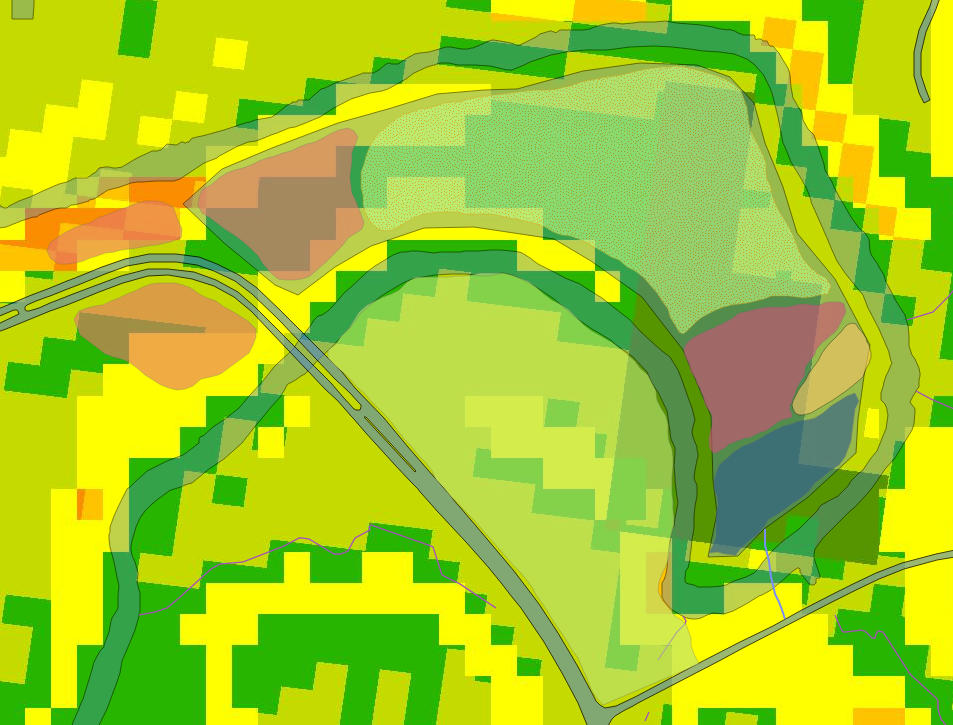
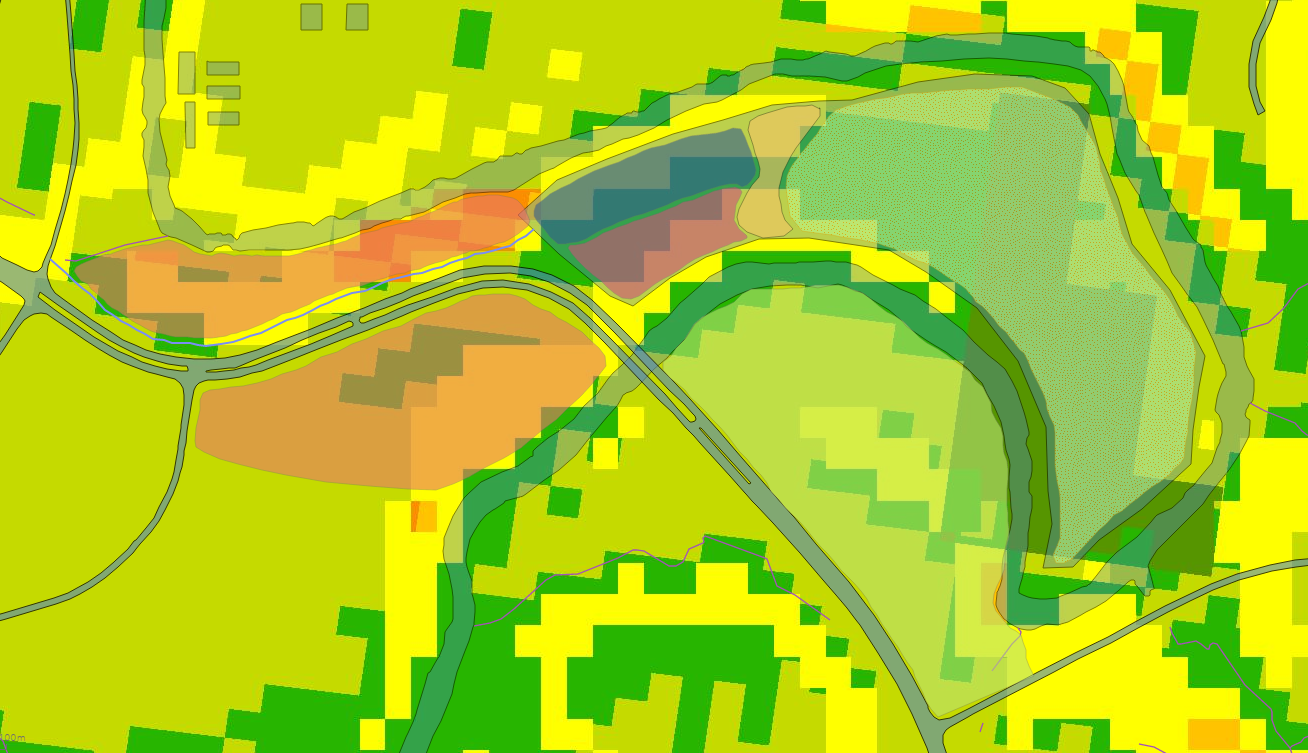 This map overlays the site design with the suitability map. Both the parking and recreation areas are located on suitable land, and the snail farm is located on the most suitable land. The road passes through the least suitable land, and designated stormwater management areas have been placed in equally unsuitable land in order to maximise site use. Conservation area has been placed on less suitable land as well, but it is important to note that this land is suitable for conservancy even though it is not the best for snail farming.
Land Allocation
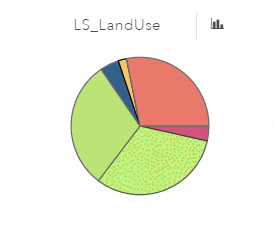
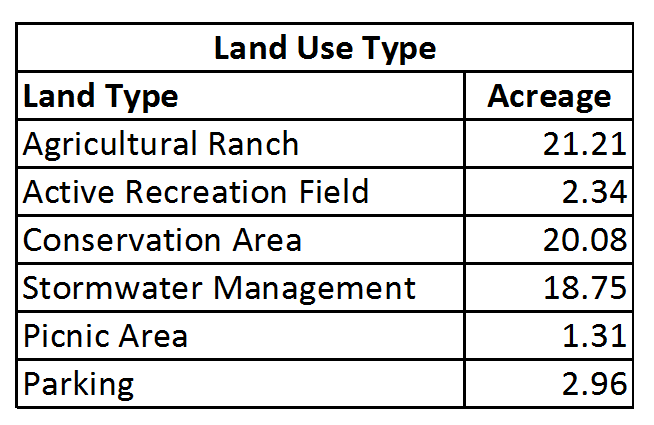
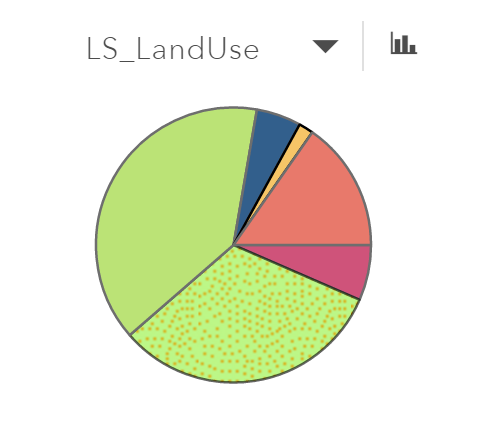
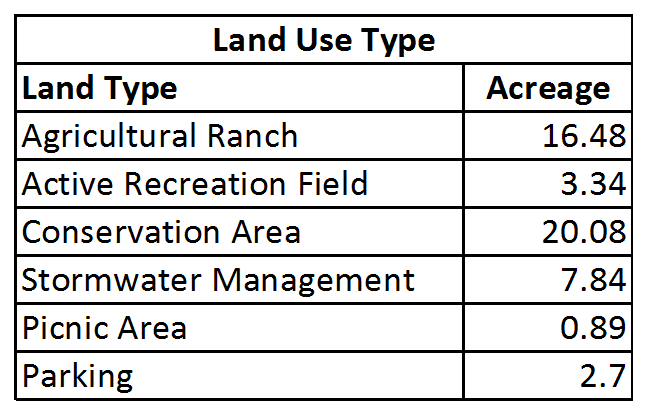
The charts above show the general ratio of each land use type included in the design on the left. On the maps themselves, dark green indicates higher suitability and values closer to orange indicate lower suitability. The vast majority of the site is in shades of green and yellow, indicating that the site is located on relatively good land. It demonstrates that although the snail farm was not completely located on the best land, the site as a whole is still quite conducive to snail farming. Therefore, the placement of the recreation and parking areas is justifiable. The tables break down the pie charts numerically to show how much land is devoted to each use and how much of each suitability is available.
Design Scenario B
Designing an Interactive Farm
 The second site design for my snail farm also creates an interactive space that allows for both recreation and commercial activities. This site is also much more compact than Design A.
The overall site is connected to Research Drive, and visitors come into a parking lot that is bordered by a picnic area and recreation field to the north. Respectively, parking is represented by the dark blue shape, the picnic area by yellow, and the recreation area by the magenta. These make up the recreational aspect of the site. Above that, represented by the green shape filled with dots, is the snail farm itself. Located there, it can be both a commercial enterprise and a potential area for education, drawing people in from the recreational areas to learn about snails and snail farming.
To the south of the snail farm and recreation area, denoted by the green shape, is a conservation area that protects the land there and leaves it as is. Finally, the red shapes indicate areas designated for stormwater management to handle the changes made to the site.
A Closer Look
 This map overlays the site design with the suitability map. If you notice, the parking and recreation areas are actually located on some of the most highly suitable land available. Dark green indicates high suitability. Normally, it would make sense to put the snail farm on the most suitable land. However, traffic concerns and the decision to place the road coming off of Research Drive to the south necessitated the placement of the snail farm itself elsewhere. This land is still quite suitable for snail farming, and part of the snail farm overlaps with the highest suitable area. Areas set aside for conservation and stormwater management have been mostly placed on less suitable land, which is depicted by ranges from yellow to a darker orange.
Land Allocation
The charts above show the general ratio of each land use type included in the design on the left. On the maps themselves, dark green indicates higher suitability and values closer to orange indicate lower suitability. The vast majority of the site is in shades of green and yellow, indicating that the site is located on relatively good land. It demonstrates that although the snail farm was not completely located on the best land, the site as a whole is still quite conducive to snail farming. Therefore, the placement of the recreation and parking areas is justifiable. The tables break down the pie charts numerically to show how much land is devoted to each use and how much of each suitability is available.