by Bonnie Hester
…and why should we care?? That’s just the question I’m going to answer in this post! More specifically, I am going to try to explain in layman’s terms how these machines work, and also why the work we’re doing with them in our class is so cool.
As you may know already, in Dr. Camp’s manuscripts class right now we are researching the way that colors were made during the medieval era and applying that research to some actual manuscript fragments from the Hargrett Special Collections Library. Dr. Alice Hunt from UGA’s Center for Applied Isotope Studies has been leading our classes in our analysis of the pigments on our fragments, which we are achieving mainly through the use of a small device that looks a little like an odd, oversized microscope called a “portable X-ray fluorescence spectrometer,” or pXRF machine. Understanding how an XRF device works requires a little background knowledge of some science-y things that many humanities majors are very happy to put away after high school, so bear with me a second!
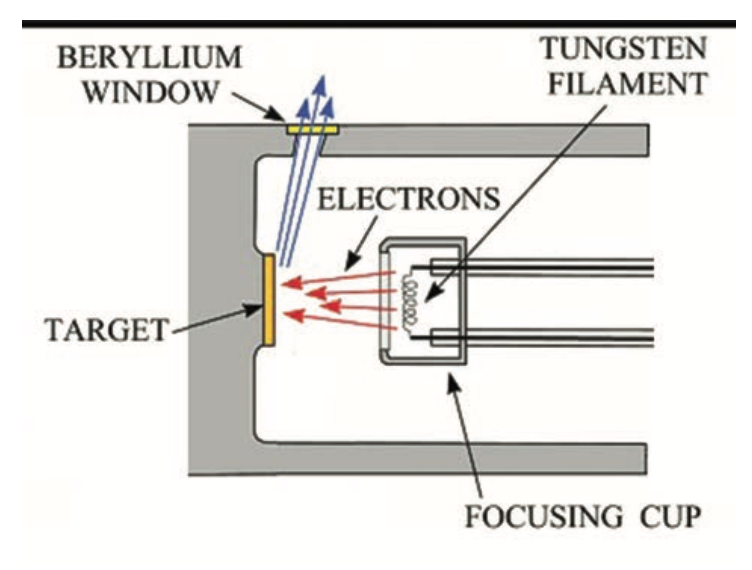
Inside an XRF machine there is a small glass tube in which a metal wire called a filament, often made of tungsten, is heated so that it gives off high-energy electrons. These electrons strike a target in front of them made from an element with a high atomic number (often rhodium). This target, which is positioned at an angle from the filament, gives off X-rays which are then directed through a small window out of the tube and towards the material being analyzed.
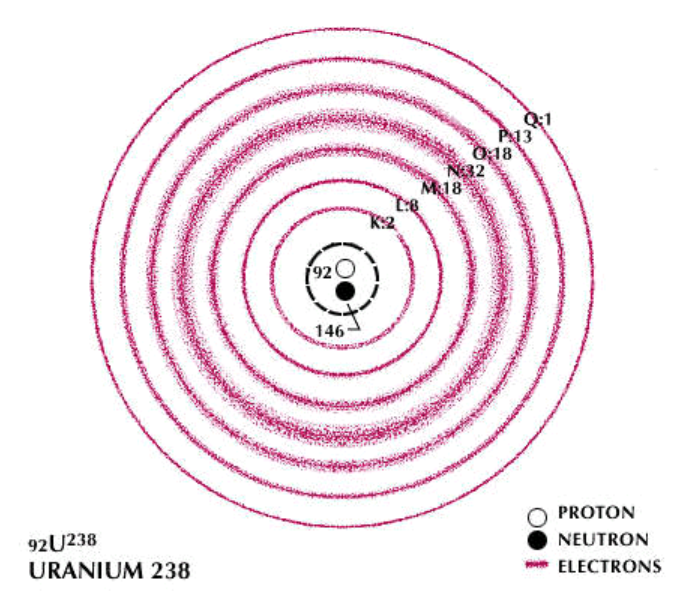
Once the X-rays hit the sample, they interact with its atoms and dislodge some of their electrons. As you might remember, electrons can be thought of as circling the nucleus of an atom in “rings,” or shells, which get bigger as they get farther away from the nucleus. The innermost shell is often labeled K, and the next L, and so forth (remember this for later!). If an electron from a lower shell (one closer to the nucleus) is dislodged, another electron from a higher shell will drop down to that lower level in order to keep the atom stable (so an electron from the L shell might drop down to the K shell). Since electrons in higher shells have more energy than those in lower shells, the act of dropping down will cause the electrons to release that “extra” energy which they no longer require. It is this release of energy (called radiation) which is measured by the machine and converted into graphical form for us to analyze.
Side note: these X-rays are very dangerous! In order to analyze any given element, we have to strike it with a sufficient amount of energy to dislodge some of its electrons. As you go up in atomic number, it requires more and more energy – a general rule of thumb is that if striking an element causes an energy discharge of a certain amount, it will have required about twice that amount to dislodge that element’s electrons in the first place. Moreover, even low atomic number elements require a great deal of energy – for our class, Dr. Hunt has been using an energy setting of about 40 kilovolts. For context, the defibrillators used to try to start patients’ stopped hearts in hospitals use about 300-1000 volts, which is a maximum of 1/40th of the energy we are using! If these X-rays were to strike us directly they would stop our hearts immediately…so no messing around in this endeavor! We are not generally in great danger of being hit, of course, since the machine has a heavy-duty safety cap lined with lead to contain the rays, and we are very sure to stand well out of their path, even if the cap is on. But I digress! Back to the science:
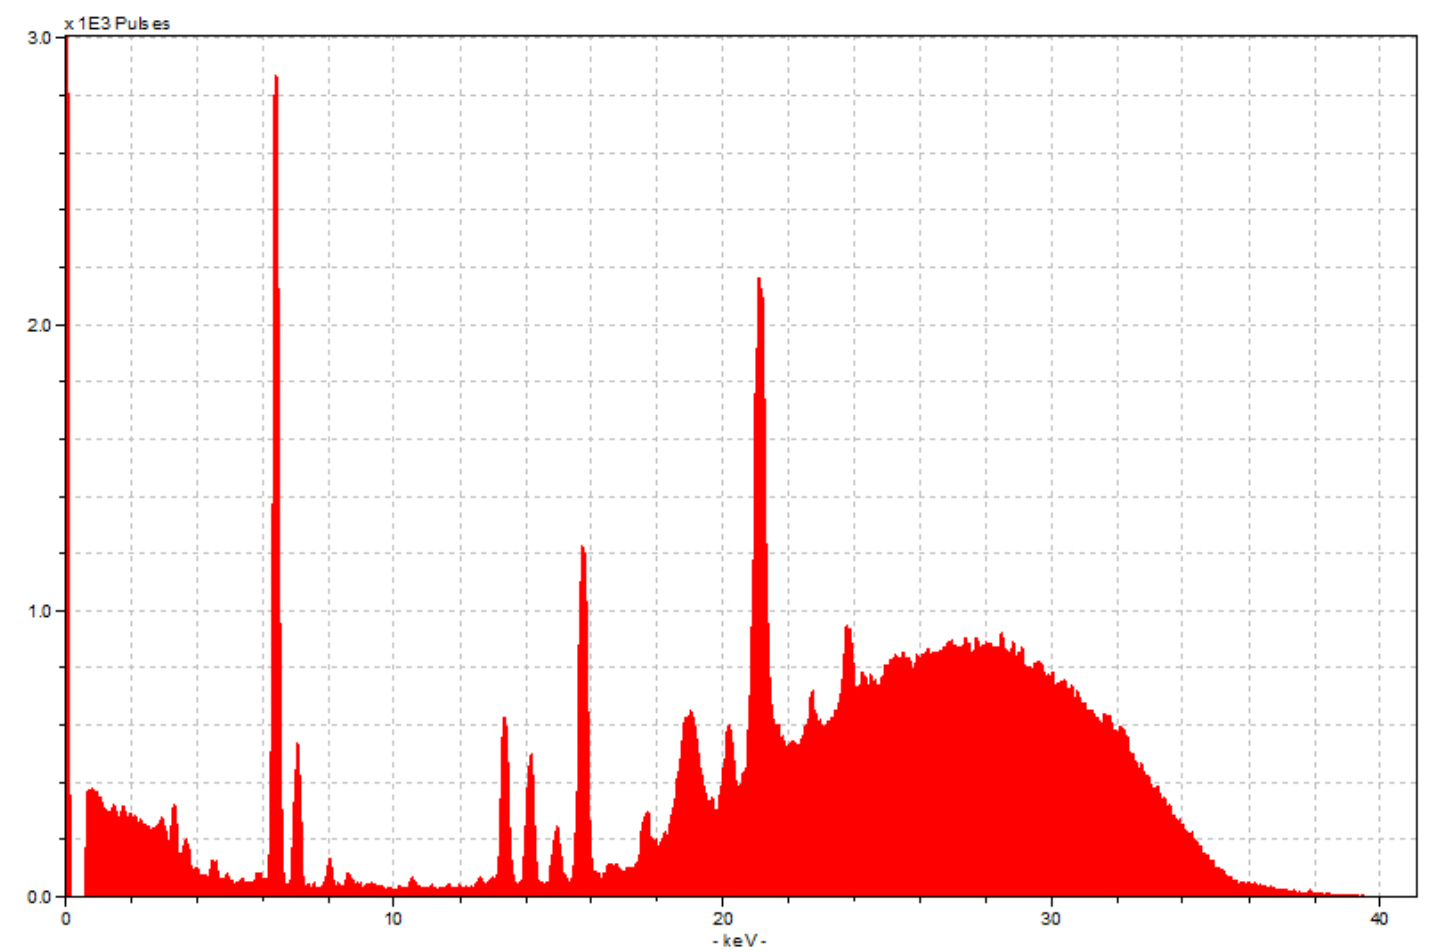
We are able to put these energy readings to good use because each element in the periodic table has a unique, characteristic level of energy it emits when struck by X-rays. We can thus match up the energy spike recorded to what scientists of far greater caliber than us have already determined to be the levels associated with each element. This, of course, is a much more complex task than it might sound initially, for three main reasons. First, our technology is not able to perfectly distinguish similar spikes from one another, so there is some overlap that creates uncertainty. Second, elements with atomic numbers less than about 16 do not give off energy discharges big enough to be measured by the machine, so you cannot use XRF to test whether or not such elements (including carbon, a very common element) are present in a sample. Third, if you dislodge electrons from more than one shell level of a given element, there will be multiple “drops” between shells so that the atom remains stable. Each of these drops will then cause a separate spike to register on our machine, since they involve releases of different amounts of energy.
Of particular importance to us are spikes caused by drops to the K and L shell levels, spikes which we call K lines and L lines respectively. The fact that elements may cause both types of lines (and more, possibly) to appear in our readings means that what we might think is an L line for a certain element is in fact a K line for a different one. For instance, my project partner and I spent time today looking at our spectra, and we had a large spike occur at the energy level where you would expect the element rubidium to have a K line. However, nothing in our research suggested we would see rubidium, and this is also around the area where you might find the L line for gold, which we know is present. Thus it is more likely that gold is causing this spike, rather than this strange other element. All that is to say, then, is that it isn’t as easy as just matching up distinct pairs of data – it takes some serious critical thinking to draw the best conclusions about to which elements are actually present.
But enough of that science mumbo-jumbo: why does this matter at all? What is the point of putting ourselves through all this physics-and-chemistry-induced trauma? First of all, there are a plethora of reasons that it is useful and important to know precisely what elements make up our manuscripts. For instance, knowing how they were made and with what can give us insights into medieval production techniques as well as into trade patterns of the time. For example, if we were to examine one of our fragments made in, say, northern France, and discovered that its blue pigment was made using lapis lazuli, then we would know that most likely, this area of France was trading through Venice to obtain this rare mineral from mines primarily in northeastern Afghanistan. Knowing how different areas of the world interacted via trade, in turn, is important because it can tell us a lot about how ideas, technology, language, and many more (even things like disease!) spread and changed. Pretty neat!
Quite apart from all of that, though, is the simple fact that doing this is actually just really cool – I mean think about it! Here we are hundreds of years removed from when these fragments were produced, using what their producers would have thought was a magic machine to discover in mere moments that “oh there’s calcium everywhere on this parchment.” We can then apply our body of research into the time period to decipher that “ah yes, that’s the calcium from the quicklime that the parchment was cleaned with!”
In other words, in this example, seeing calcium is conclusive, in-your-face evidence that a long time ago, an actual human being did indeed take this piece of cow or sheep skin and dunk it in some quicklime to clean it so it could become part of a book. No longer is “wash with quicklime” just an abstract idea in a textbook, the first thing we write down when Dr. Camp asks us to go through the steps of making parchment. Instead it is concrete, tangible – we can say with near certainty that THIS particular bit of parchment that we are holding in our hands right now was washed with quicklime by some European guy almost five hundred years ago in some field or shop. And THAT is cool.
Notes
Images from: Hunt, Alice, and Robert Speakman. Doing pXRF Right: An intermediate course for Archaeologists. Center for Applied Isotope Studies at the University of Georgia, 2015.