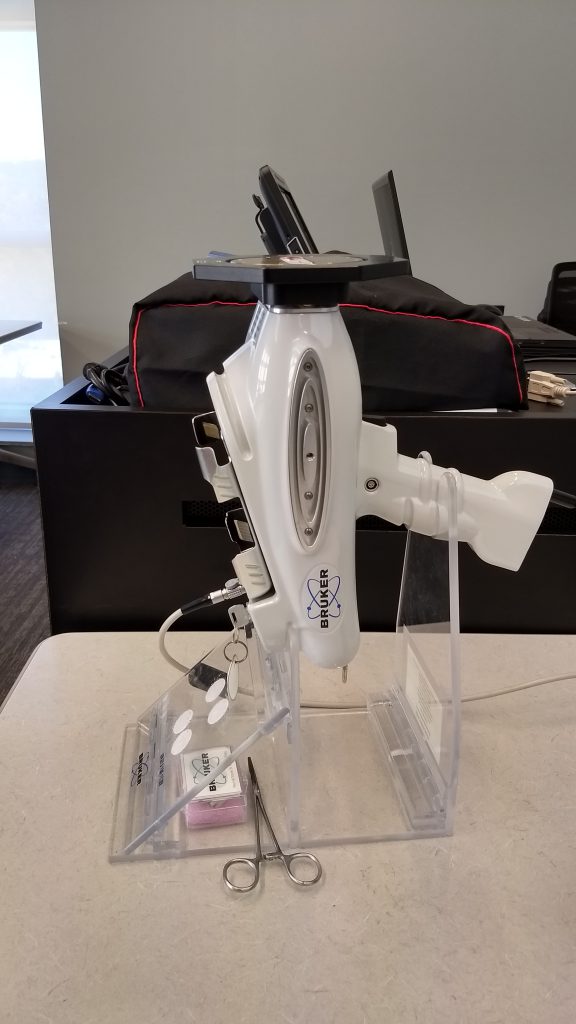
This is the week we’ve been waiting for all semester: the week when Dr. Alice Hunt of UGA’s Center for Applied Isotope Studies brings a portable XRF device into our Special Collections Library classroom. I’ve described elsewhere (in very simple, layperson’s terms) how the device works, and you’ll be getting more detailed explanations in future posts. TL;DR: the device uses X-rays to excite the electrons in the sample’s atoms; those excited atoms then give off an energy signature unique to each element. So we can identify (in theory) exactly which elements are present in a small spot – about the size of a pencil eraser.
In practice, it’s a LOT more complicated than that, and you’ll be hearing more about our data-interpretation successes and woes in the coming days. In this post, I’d like to think about the prep we had to do before Dr. Hunt arrived: what kind of information did we have to know in order for the XRF’s readings (called spectra) to be useful?
In this version of the class, we’re interested in which pigments were used for the writing and decoration of five fragments in the Hargrett Library’s collection. Is that blue ultramarine or azurite? Is the ink carbon black or iron gall ink? How pure is the gold leaf? Because the XRF identifies elements, we need to know which elements we might find in any given colorant. That means knowing how paints and ink were made in the time and place our fragments were created (so, western Europe c. 1300-1500). Once we know what raw materials went into different colors, we can articulate the chemical formula of those raw materials. And, knowing the chemical formula, we can identify which elements we expect to appear on the XRF spectra.
The device has a number of limitations, however. The biggest one (for this post’s purposes) is the pXRF’s inability to identify low-Z elements (elements with small atomic numbers). Because the elements release their signature energies when electrons jump from one energy ring to another, these low-Z elements can’t be detected by the XRF device – they don’t give off strong enough energy signatures. So carbon (C, atomic number 6) — the base element of parchment or paper — isn’t going to show up on the spectra. This is bad, because it means we can’t identify organic colorants like madder, chlorophyll-based greens, or carbon black. (But even if we could, there would be no way to distinguish between the carbon in the parchment and the carbon in madder anyway, so no harm done.)
Take ink, for example. We’ve got two options for how ink was made in the Middle Ages: carbon black, made with carbon (from soot or charcoal), or iron gall ink, made from copperas (ferrous sulfate) and tannic acid. So, if we’re exciting the electrons in an ink-only sample, we anticipate finding either nothing (indicating, via process of elimination, that the ink must be carbon-based) or else iron, from the copperas.* Voila, identification successful.
So the prep work for this week entailed two sizable steps. First, we learned how medieval inks and pigments were made so we could know what elements went into each of them. Second, the students (working in teams) carefully examined their fragments to decide which eraser-sized spots to examine with the XRF and to develop a hypothesis (based on their color research) as to which elements they anticipated finding on each spot.
When the students blog about their fragment analysis, they’ll discuss their hypotheses (why they chose these spots and what questions they were asking of their pigments). Here, I’d like to discuss the color research we did.
The goal of the color research was to crowdsource a detailed body of knowledge on every pigment we were likely to run across in our fragments. If that research wasn’t robust and accurate, we would have real trouble identifying the pigments in our fragments and parsing the significance of their presence. Each student was given a different color (some common colors like red got split between two students) and produced a report on that color. Those reports identified the primary ways those colors were produced, the sources of the raw materials that went into the pigments, the way those raw materials were processed to create the colorant, the chemical makeup (with formula) of the pigment, and any specific date/place parameters of that pigment’s use. These reports then became the “textbook” that the students used for developing their fragment hypotheses.
We had a lot of great support in this research endeavor. The fine librarians at Main Library put together a LibGuide filled with (starter) digital and (detailed) print resources for doing this kind of research. Two of those digital resources are worth telling y’all about, in case you want to play along at home. First, the Fitzwilliam Museum’s website Illuminated: Manuscripts in the Making beautifully presents the process and results of extensive scientific analysis of manuscript illumination; their “Lab” section talks about the most common colorants identified in their research. (That site also offers a glimpse into the depth of knowledge that can be gathered through this kind of research.) Second, the Pigments Through The Ages site provides a nice breakdown of which pigments were used where and when, with basic chemical and production background.
All this research into how pigments were sourced and produced – and what elements those pigments therefore contain – grounds all our work for the rest of the semester. Expect to see many posts from me and the students in the coming weeks that build upon this foundation as we figure out which pigments are present in our fragments.
*The other elements in a standard iron gall ink are low-Z elements, so they won’t show up.