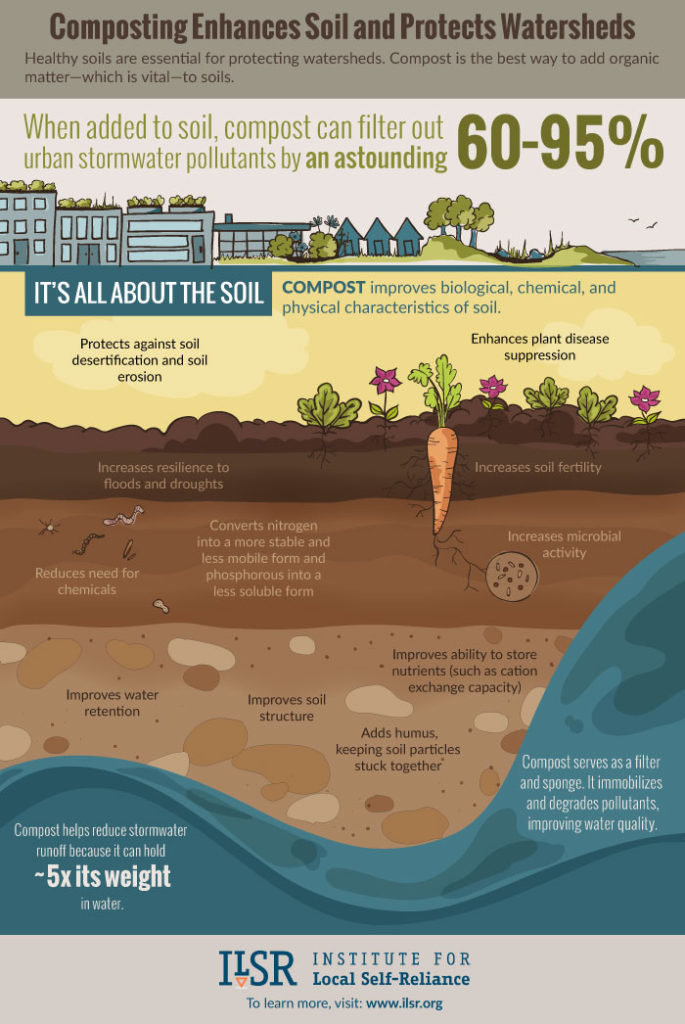
I chose this infographic because I think it is extremely educational in an eye-catching way! This infographic is designed in a creative way because it points out specific details about how compost is beneficial to the soil and watersheds by placing the facts in the different layers of soil. It is intellectually stimulating in the same way because as the audience reads each advantage to composting, they can see where the benefit might help specifically in the soil. For example, in the deeper layer of soil, the infographic tells us that composting can increase microbial activity. This would not happen at the surface of the soil, so the designer chose to place this fact where it was relevant – within the soil. This infographic is also relevant to the audience because not only are they learning what the benefits to composting are, they are learning more specifically where these chemical and physical changes are happening. The audience can know what to look for in their own garden with the information in this infographic!
My initial reaction to this infographic was that I was surprised. I like how this infographic ties together what we have been learning about all semester. We first began the semester by exploring the watersheds in Athens. Now that our next unit is about soil and composting, it is really fascinating to see how the two areas of biology go hand in hand! This was something I had not considered before. Though we have had many discussions in class about the two processes (watershed systems and composting systems), I kept them in separate categories in my head. I think the creator of this infographic was hoping to put the necessity for composting into perspective for his/her audience. Not only does composting increase the quality of the soil, but this effect can lead to sustainability with other aspects of the Earth, too! Because the soil is rich, it can hold more water and reduce stormwater runoff that pollutes our environments.
This infographic was made from the information provided by the Institute for Local Self-Reliance organization. As a class, it is important to use information that we not only find relevant, but accurate. We should be looking at credible materials that we can trust. For the infographics we make for UGA students, I believe we should look specifically at research that has been done about composting in Georgia specifically or in areas with a similar climate and quality of soil. Furthermore, I think this infographic leaves out one key aspect that we should include in our class infographics that we create. This infographic does not include a guide on how to get started with composting. It also does not give any information on the best way to compost or where to find this information should you want to start composting in your garden. I believe educating students about how to compost safely and effectively should be one of our main focuses when creating infographics. I look forward to what we will make together as a class! – Sarah Kate