Once again, the end of the semester has snuck up on us like a steam train in need of a tune-up, and we’re all scrambling to get out of its way. But our students have finished in fine style. They’ve completed their analysis of the pigments in some of the Hargrett Library’s fragments, they’ve turned in reports on their discoveries, and they’ve written their blog posts (here, here, here, here, and here) highlighting their frustrations and remarkable findings.
I’m going to close out this course with a series of posts synthesizing this last unit: what we discovered, what I’ve learned about how to better teach the chemical analysis of pigments, and what I believe the value has been of asking humanities students to do a bit of scientific analysis.
(Need to catch up on how the unit started? Or what analytic device we were using?)
First: what did we learn about our fragments?
When the semester began, I selected five fragments from the Hargrett Library’s collection for the students to study intently, first in a formal fragment description exercise and now through chemical analysis of the pigments. These are almost all single leaves from Bibles or Books of Hours, the kinds of books produced in bulk in the later Middle Ages. The outlier was a beat-up bifolium from a liturgical book we’re still in the process of identifying. I selected the more elaborately decorated options in our collection as best I could, so the students could develop more sophisticated research questions about the colors (as did this group in particular).
I didn’t anticipate unusual pigments to appear in this set of materials, as they would have been constructed in professional bookmaking environments. Overall, I was right. All our blues were copper-based azurite (no ultramarine or organic blues), the few greens we tested were copper-based, so either verdigris or malachite (that is, no organic greens), and our reds were mercury-based vermillion, sometimes accompanied by an organic red like brazilwood or madder (see here and here), with one example of red lead used for rubrication instead of vermillion.
In nearly every case, the process of identifying the signature elements was not complicated, once the students became comfortable with the software we used to read the spectra. What’s a spectra? It’s a graphical readout of the different energies emitted by the elements in the sample, after they have been excited by the pXRF device. Here’s one example:
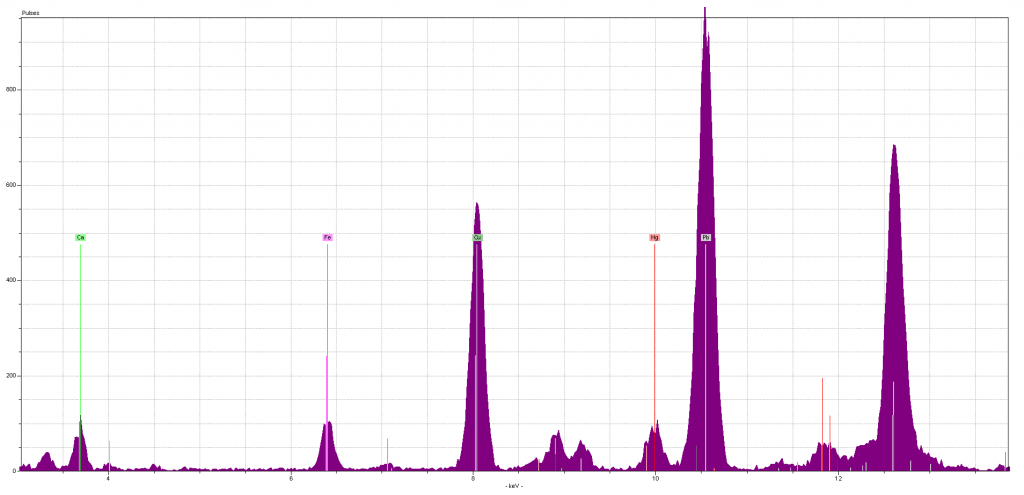
The peaks are the different energy readings: the higher the peak, the more energies that element gave off. As you can see, the software will help identify which elements emit which energies (and each element can give off multiple energy lines, although usually there’s one dominant energy line for each element). In this example, there are background readings for calcium (Ca, labeled in green) and iron (Fe, in pink), and mercury (Hg, in red). There’s a lot of copper (Cu, in dark green) and lead (Pb, in grey): both not only have tall peaks, but their secondary energy lines (to the right of each labeled peak, in the same color) are also prominent. So when you have a simple yes or no question, like “is there copper in this blue sample?” your answer is easy to come by.
It’s the unanticipated elements that caused problems, as we saw (for instance) in many of our ink samples. All our inks were iron gall, but the recipes for iron gall ink were so variable (and the opportunities for impurities to be included so great) that, in the spectral analysis, we often found elements like copper and zinc mixed in. We weren’t prepared for this (more on that in the next post!), so the best we could usually say was, “Huh, there’s other stuff in this ink.”
The same is true of our gold samples. We thought the gold sampling would be straightforward, because, well, gold is an element. Boy, did our fragments school us. Most of our gold samples turned out to be alloys of differing mixtures, but because we didn’t know what ratios of metals to expect, we often had a hard time interpreting the evidence. This was certainly true for these students, who seemed to have differing alloys in two initials illuminated on the same leaf! An even more drastic change in alloy makeup showed up in the bifolium. The two upperclass students’ samples revealed that the gold (Au) was alloyed with copper (Cu) and perhaps zinc (Zn). But when my First Year Odyssey students had Dr. Hunt analyze a different initial in that same fragment, they discovered copper and zinc (so, brass!) – and no gold at all. You can see the three gold samples overlaid below (the first-year students’ much quieter sample is in pink and the upperclass students’ samples are in dark and light blue).
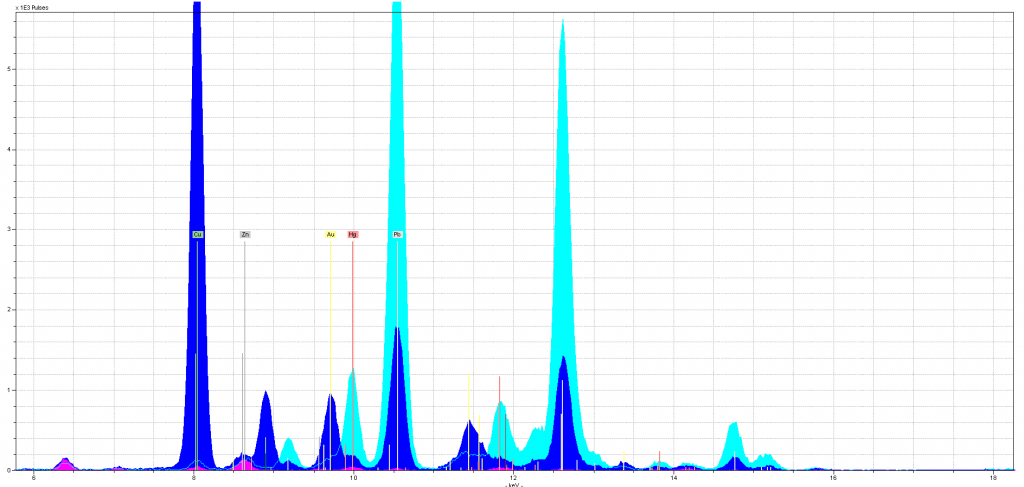
There is no gold (labeled in yellow on the spectra) in the pink, FYO sample, perhaps a small amount of gold in the light blue sample, and a lot of gold in the dark blue sample. Interestingly, the levels of zinc (labeled in grey) stay close in the three samples as do the levels of copper (in green) in the pink and light blue (the extra copper in the dark blue can be attributed to the azurite that surrounds that initial). Again, we have results we can only roughly explain, because we need better context. What are the possible alloys that illuminators would use for gold leaf? What kinds of alloys, and ratios of metals, are expected and which are unusual? Under what circumstances would you find “gold leaf” without any gold in it at all?
Some of our outstanding questions are, I suspect, true weirdos. Like the students who found a “mercury blue” in their fragment: a blue pigment that seems to have been made out of mercury. That’s a chemical impossibility, like a unicorn or a manticore, a figment of medieval alchemists’ imaginations that some treated as possible. But when the pXRF revealed that there was indeed mercury in the blue ink, we all had a moment of dislocation. It was like looking out the window and seeing a phoenix burning in your yard. It’s can’t be true, but there it is. It’s a puzzle that will take more advanced analysis methods in future semesters to truly decipher.
But some of our questions, like the alloys for gold leaf or the different recipes for iron gall ink, are possible for us to answer with more precision. Now that I’ve run this class once, I have a much better sense of how to best prepare humanities students for this kind of scientific analysis. More on that in my next post – for now, a serious shout-out to this class for taking the ride with me, bumps and all!