
I was not able to get a clear copy of the infographic, so please go to https://ilsr.org/compost-impacts/ to get a better reading.
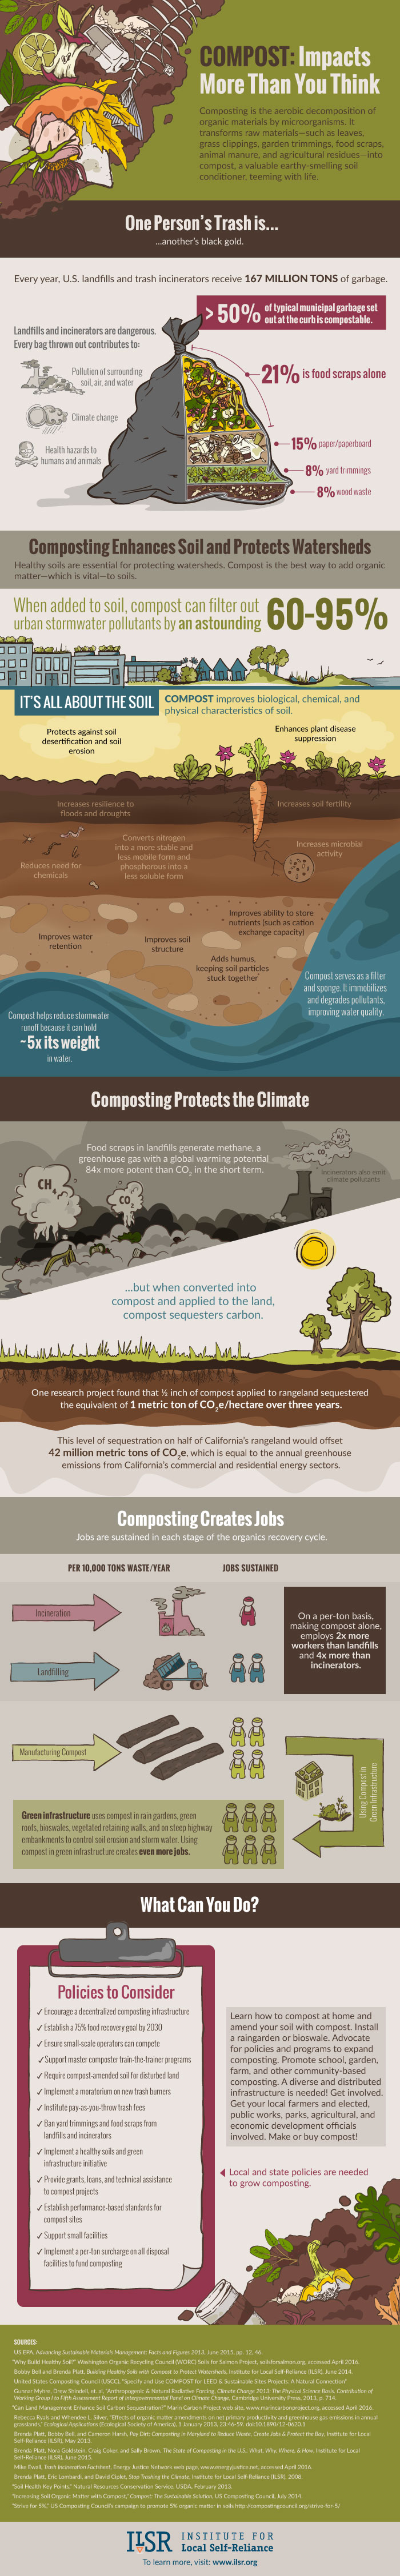
What: This infographic is intellectually stimulating. After a brief explanation of what composting is and consists of, the reader is immediately taken to a simple yet powerful picture of a garbage bag with one side looking gray and the other side with contents of what most people would actually throw into the bag. This is a compelling image because it also attaches percentages to what can be composted in regards to what gets thrown into a trash bag, coming to a conclusion that more than 50% of what is thrown in a trash bag can most likely be composted instead. This picture makes the idea of composting more relevant to the audience because it literally depicts that composting does not require out-of-the-way materials, but instead materials which are getting thrown away on a regular basis. This infographic is also creative in that it does not only describe how composting can obviously help the environment, but it also appeals to those who may not be so interested in the environment by incorporating how composting can help the economy by creating jobs. This way, the infographic serves the purpose as being informative and attractive to all kinds of people.
Gut: I was quite pleased with this infographic. I felt like this was a well-rounded graphic which organized the material in an easy-to-follow way. While most people know that composting is beneficial to the environment, I really liked how this infographic dived into the specifics of how composting can legitimately improve the environment. It explains the benefits to the soil by literally going through the different levels of the soil and inserting the positives. The graphic also states the harms of food scraps to the climate and then immediately turns the mood around when depicting what happens to the climate if food scraps are converted into compost. This infographic really succeeds in the job of not just telling but also showing.
So What: While I knew that composting is beneficial to the environment, also as mentioned in the infographic, the graphic also includes information on how it can directly impact a person’s professional life. The infographic displays information on how composting can create jobs. This is a factor of composting I had not considered before, but it is definitely an important one. By including this bit of information, I feel like the creator was trying to depict to the audience the importance of composting outside of the environment. This allows for the infographic and the concept of composting to appeal to people who may not be so environmentally mindful. After following through the sources listed, it seems as though the statistics in regards to the number of increased jobs is coming from their own website, Institute for Local Self-Reliance and press-release. As far as how we might be able to find this information also can be through specific searches on the internet, as the creator of this infographic did when wanting to describe the increase in jobs through composting.
Now What: Even though this is a great infographic, I wished it had expanded more on what people can do to compost. The last bit suggests on policies people can consider, however it does not mention legitimately how people can compost. A reason why they may have left this out might be because they were trying to appeal to people working at the local and state levels who can implement policies to encourage composting. We can use this as inspiration for the graphic that we create by making sure that while we still include the benefits to composting, we should also include how composting can be achieved for a common being without it becoming too complicated.