
Part I. Community Guide Update and Rationale for Intervention
| Author & Year | Intervention Setting, Description, and Comparison Group(s) | Study Population Description and Sample Size | Effect Measure (Variables) | Results including Test Statistics and Significance | Follow-up Time |
| Coles, Fletcher, Galbraith, Clifton. 2014. | This study looked at the difference in weight loss and other health outcomes in patients with diabetes based on whether or not they had choice in their dietary plan. One group was allowed to choose between three diet plans while the other group was assigned a selected diet. Subjects were measured at 3, 6, and 12 months for specific health outcomes with counseling and nutrition education at specific points in between. Subjects were also encouraged to exercise for 30 minutes a day and were provided with pedometers. | The subjects of this study were volunteers with physician- diagnosed Type 2 Diabetes or pre-diabetes. The population was aged 40-75 years with body mass index greater than 27 kg/m2. The sample size = 144; 73 in the No Choice group and 71 in the Choice group. | This study measured systolic and diastolic blood pressure, glycosylated hemoglobin, fasting glucose, triglycerides, total, HDL, and LDL cholesterol, high sensitivity c-reactive protein, medication changes, diet changes, weight changes, and physical activity changes. | Weight: No Choice -3.5+/-4.5 kg; Choice -2.7+/-5.0 kg (no significant difference)
Physical Activity: No significant changes Medication Changes: 19 participants had physician recommended changes to their medication. Change in body weight at 3 months for these subjects was significant in comparing subjects with no medication changes (-2.4 kg vs. -4.4 kg, p=0.07) Cardio-metabolic changes: There was no effect of diet group for any variable. The only significant difference was in SBP, DPB, and fasting glucose (-6.4+/-17.4 mmHg; -3.9+/-10.8mmHg; -0.42+/-1.75mmoL/L respectively) |
3, 6, and 12 months |
| Jayasuriya, Pinidiyapathirage, Jayawardena, Kasturiratne, Zoysa, Godamunne, Gamage, Wickremasinghe. 2015. | This study took place in Sri Lanka_ in a primary care clinic in an urban/suburban area. Treatment groups were “usual care” in which subjects attended their usual clinic appointments with content typical of a diabetes clinic, and “intervention” in which additional counseling was provided. The intervention consisted of a “Self-Management Plan“ in which clinicians assessed the subjects with a “motivational interviewing approach.” Subjects were also assessed through goal setting and completion of their established action plans. Dietary goals included reducing sugar and increasing vegetables. Physical activity interventions were culturally appropriate. | Subjects were type 2 diabetics, either previously diagnosed or diagnosed with a free HbA1c test, living within 10km of the clinic, aged 40-70 years, and have access to medication. 85 subjects were randomized into the “usual care” group, n=42; and the “intervention” group, n=43. | This study primarily measured HbA1c as well as diet, physical activity, systolic and diastolic blood pressure, lipid levels, abdominal adiposity, body weight, and self efficacy. | HbA1c decreased in the intervention group significantly from 9.8% to 7.0% (P<0.001), and in the usual care group 9.7% to 8.3% (P<0.005). A significant difference was found between the groups as well (P=0.035). Total Cholesterol decreased in the intervention group significantly 172.1 to 156.2 (P<0.025) and in the usual care group 197.8 to 159.8 (P<0.032). The waist to hip ratio decreased significantly in the intervention group 0.895 to 0.871 (P<0.035). Total energy intake was significantly reduced in both groups, and there was a higher reduction in the intervention group. 1856.6 kcal to 1631.6 kcal (P<0.006) reduction for the intervention group; P<0.001 between groups. Self-efficacy increased in the intervention group, and there was a significant difference between groups (P<0.001). | 6 months |
| Juul, Andersen, Arnoldsen, Maindal. 2015. | This study took place in Denmark. Subjects were placed into a control group or an intervention group. The intervention group received counseling in 4 2-hour sessions by health care staff, dietitians, and occupational therapists. The content of these sessions was developed based on public health theories such as Health Literacy Theory and Mezirow’s theory of transformative learning. | Subjects were recruited from primary care practices in Denmark. Subjects were less than 70 years old and had fasting glucose levels between 6.1 and 6.9 mmol/l. 127 subjects were randomized into the control group, n=64, and the intervention group, n=63. The majority of subjects were women. | This study measured weight reduction, fat intake, energy intake, fiber intake, and changes in physical activity level. Other measurements include blood pressure, HbA1c, and cholesterol. | There was no significant difference in total fat intake. The intervention group saw increased fiber intake at 3 months (>15g/1000kcal fiber), but not at 12 months. The intervention group had more who achieved weight loss of at least 5%, 29% of subjects in the intervention group versus 3% of subjects in the control group (OR=10.17).The intervention group had significant reduction of waist circumference of -2.8+/-1.6cm. Changes between the groups were statistically significant. | 3 and 12 months |
As of July 2014, this strategy is “Recommended” based on strong evidence that diet and physical activity reduce the onset of new Type 2 Diabetes cases. It is also recommended because it reduces other risk factors that contribute to diabetes such as body weight and blood pressure. Based on the previous research of 53 studies reviewed by the Community Guide Task Force and the studies that were presented in the table, diet and physical activity as a strategy to reduce or control Type 2 Diabetes is still “Recommended.”
The recommendation is unchanged from before because there have not been additional studies done to change the strength of the recommendation. The studies included in the table are related to diet and exercise and Type 2 Diabetes, but do not support or negate this particular strategy. For example, one study compared whether choosing or being assigned the particular diet made a difference in diabetes risk factors. While there was no difference between the “Choice” and “No Choice” groups, the study still supported that diet reduced risk factors of diabetes. The other two studies neither negated or supported this strategy because they dealt with methods of delivering counseling about diet and exercise, not specifically testing the effects of these.
Based on searches done in the PubMed and UGA Library databases as well as Google Scholar, I could not find any new research published since the Community Guide recommendation in 2014 that specifically measured the effect of diet and exercise on the prevention or management of Type 2 Diabetes. The previous evidence was strong enough to support this recommendation without the immediate need for future research. Previous studies used in the Community Guide provided diet goals, weight loss goals, and physical activity goals for subjects and included various forms of counseling sessions. All of the previous studies showed a decrease in the proportion of people who developed Type 2 Diabetes, an increase in the proportion of people who showed normal blood glucose levels, and a decrease in body weight. For these reasons, the recommendation holds as “Recommended.”
Part II. Theoretical Framework/Model
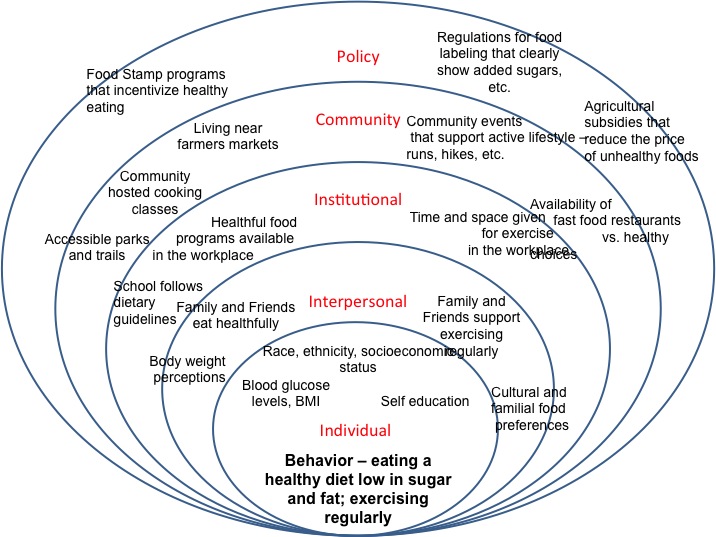
Diet and exercise are often misconstrued as purely personal achievements. However, these changes occur in a variety of environmental frameworks which must be considered when designing interventions. Interventions that consider various segments of society that individuals interact with are generally more successful, especially in dealing with diet and exercise. The Social Ecological Model describes these segments or levels of the environment and can be used to develop multi-level interventions. This is especially helpful for health problems that are extremely prevalent, such as diabetes.
The Social Ecological Model acknowledges that there are many different factors at many different levels that can influence a behavior. In order to change a behavior, one can make changes at the individual level, interpersonal level, institutional level, community level, and policy level. Interventions can even occur at a combination of these levels in order to be most effective.
The individual level describes any characteristics or factors of an individual that can influence behavior, such as race, gender, socioeconomic status, etc. It can also include biological factors such as body mass index, blood pressure, genetics, etc. Some important factors to consider for increasing physical activity and healthy eating habits for people with or at risk for diabetes include their race, socioeconomic status, current blood glucose levels, BMI, and their ability or interest to self-educate.
The interpersonal level describes close relationships to the individual such as family, friends, and colleagues. These “social support systems” can provide positive influence on the individual’s behavior – such as if the family encourages the individual to eat healthy – but can also provide negative influence – such as if friends encourage regular eating out and colleagues often bring sugary treats to work.
The institutional level mostly describes factors that occur in the individual’s institutional interactions, such as churches, schools, and the workplace. Unlike interpersonal factors that deal with the social relationships, the institutional factors deal with the rules in place at those institutions. This is an important level for reducing and preventing diabetes because there is much being done at the elementary school level to increase physical activity, reduce sugary beverage consumption, and incorporate healthier meals into the cafeteria.
The community level is the next bubble in this model because it incorporates the relationships between institutions, groups, and personal relationships in a community. It is the social network beyond just the individual’s friends and families. Traditionally, this level only included the social factors associated with community, but for health problems such as diabetes, it can also be beneficial to include aspects of the built community. For example, a community can support a healthy lifestyle and host events that promote physical activity or cooking classes, but if the built environment is not conducive to these activities, there is a major hindrance to the individual’s behavior change. For diet and physical activity, changes in the built environment of the community could include access to walking trails and parks, as well as access to grocery stores and fresh farmers markets.
The policy level is the final bubble and includes any laws, decisions, policies, etc. that occur through government. For example, in Athens, GA, individuals are able to double their food stamps to use at the Farmers Market based on a local policy initiative. At the national level, government subsidies of corn in the U.S. make corn syrup sweeteners a very cheap commodity, and thus, unhealthy, sugary foods become very affordable and would potentially decrease healthy eating at the individual level.
Part III. Logic Model, Causal and Intervention Hypotheses, and Intervention Strategies
The target population will be adolescents enrolled in Athens-Clarke County Middle Schools, grades 6-8. This intervention focuses on adolescents for two main reasons. 1) Healthy diet and physical activity must be established as a habit, and youth is a very formative time to incorporate fruits and vegetables, exercise, and other healthy habits into your daily life. These lesson plans will be introduced now with the hopes that healthy habits will continue on throughout their adult life. 2) This intervention will focus on adolescents communicating with their families and disseminating information they learn through lesson plans. Not only does this hope to strengthen the interpersonal connections between students and families and address environmental factors that could be barriers to healthy diet and physical activity, but also it is an efficient way to transfer information to parents who are busy working and do not have time to attend weekly information sessions or workshops.
The intervention will take place within the schools, during the regular school day, as part of a weekly hands-on educational session. Athens-Clarke County public schools have high rates of poverty and a large minority population. 79% of those enrolled are “economically disadvantaged,” 53.9% are black, and 18.6% are Hispanic. In 2013, the County Health Ratings reported 21% of Athens-Clarke County residents as having “limited access to healthy foods,” a community level risk factor for diabetes, and 19% report physical inactivity. Diabetes mellitus is the 8th leading cause of death in Athens-Clarke County (2006-2010). For these reasons, public schools are an appropriate intervention setting. Not only will children be reached in these at-risk populations, but also families of similar demographics.
| Intervention Method | Alignment with Theory | Intervention Strategy |
| Provide access to information about healthy diet and exercise within the school | The institutional level is critical within the Social Ecological Model. It is important to have interventions built into an institution such as the school so that the environment can contribute to changed individual behavior. Interventions at the interpersonal or individual level would not be as effective if the institution that the individual participates in does not align with the behavior change. Thus, a school setting is most effective to incorporate it into the norms and rules of the individuals day-to-day life. | Have a weekly class period devoted to learning about healthy diet and exercise. This can be led by a trained nutritionist, physical education teacher, or health teacher after they are trained in specific modules that incorporate information about diabetes. |
| Create stronger interpersonal bonds between students and their families; create channels of communication between students and their families. | The interpersonal level within the Social Ecological Model is also an effective area to address change. By encouraging relationships and conversations between students and their families, students can convey the information learned in class while also creating an environment at home in which they can practice what they are learning. This can also disseminate information to the families themselves who may be at risk for diabetes. | Lesson plans can focus on hands on activities such as cooking classes, food preservation classes, fun family exercise, and other activities that can also be completed at home with the family. These activities must be affordable and accessible, especially for low-income families or families without access to fresh food or parks. Students can keep a journal about their weekend activities with their families to reflect on how their home environment is changing. Students can also take home clear and simple information packets to share with their family. |
| Increase individuals’ self-efficacy and knowledge | The individual level is the level within the Social Ecological Model can also be altered to affect change. This change is most successful when you also address other environmental factors such as the interpersonal levels and institutional levels like this intervention considers. Attributes like the perception that the individual can make change and the interest in self-education are important individual qualities that can impact behavior change. | Increase students’ feelings of self-efficacy by providing access to resources within the classroom space and education on how to use those resources. I.e. cookbooks, internet resources, using dietary guidelines, etc. Practice role playing within the classroom space so that students feel comfortable talking about this information with their families at home. Furthermore, the hands-on activities themselves, when completed successfully, will increase students’ perceptions that they can achieve these tasks successfully. |
| Increase knowledge regarding barriers to healthy diet and physical activity. | Barriers to behavior change can occur at many different levels of the Social Ecological Model and can happen in many forms. It may be hard to predict how students will experience barriers in each school, but it is important to address as many barriers as possible so that and individual’s entire environment is conducive to behavior change. | Students will reflect weekly in their journals. They will reflect on the things that prevented them from carrying out the diet and physical activity objectives from the weekly lesson plans. At the end of the 16-week period, teachers will review the journals and submit this information to the researchers so that the researchers can address some of these barriers in the future and/or spread the information within the community so that other community partners can address those barriers. |
Logic Model
| Inputs/Resources | Activities | Outputs | Short-term Outcomes | Intermediate Outcomes | Long-term Outcomes |
| Curriculum and Development of Curriculum
Trained staff/teachers
Designated time and space within the school day (Could take place during a “break-out” or “cluster” period)
Access to curriculum via online modules
Funding via grants and through the public school system
Goods for activities such as kitchen supplies, computers, etc.
Tracking/evaluation system for the students such as journals or online blog |
Weekly classes with hands-on activities regarding healthy diets and exercise.
Weekly classes that encourage students to engage their families at home. Teacher training and lesson plans via online modules. Students will have weekly pamphlets to share with their families. Students will have weekly assignments based on the lesson plans to engage their families. (E.g. cook a healthy meal with your family) Students will keep a journal to reflect on barriers that prevented them from carrying out healthy behaviors at home.
|
Online module/curriculum for 1) teacher training and 2) 16 weeks of lesson plans 16 weekly pamphlets/information to be brought home to families 16 journal entries per student that reflect on barriers.
Evaluation forms from each teacher/group that reports the student-reported barriers |
Increase students’ individual self-efficacy, knowledge and skills regarding healthy diet and exercise habits.
By participating in the research/reflection component, increase students’ motivations to engage in the behaviors. Disseminate information to families and increase their knowledge and skills.
|
Increase healthy eating habits and increase physical activity in students.
Increase healthy eating habits and increase physical activity in students’ families. |
Reduce rates of diabetes in Athens-Clarke County.
Reduce rates of obesity in adolescents in Athens-Clarke County.
Increase adolescent empowerment to change behaviors and communities.
Make necessary community and institutional changes so that infrastructure and social systems encourage healthy diet and exercise. |
Intervention Hypothesis:
Lesson plans that include cooking classes and reading nutrition labels will increase students’ knowledge and self-efficacy to make good food choices.
Lesson plans that include engaging their families at home will increase families’ knowledge of healthier diet and exercise habits.
Lessons plans that include education on how to engage with families at home will increase students’ self-efficacy to educate their families.
Journaling and reflecting on barriers to healthy habits will increase students’ motivation to engage in those behaviors.
Causal hypothesis
An increase in students’ knowledge and self-efficacy regarding healthy diet and physical activity will increase healthy eating and physical activity behaviors.
An increase in families’ knowledge of healthier diet and exercise habits will increase healthy diet and physical activity in students’ families.
| Stakeholder | Role in Intervention | Evaluation Questions from Stakeholder | Effect on Stakeholder of a Successful Program | Effect on Stakeholder of an Unsuccessful Program |
| Student | Directly served by intervention through weekly classes and reflection | Have I benefitted from this intervention?
Has my knowledge regarding diet and physical activity especially related to diabetes changed or increased? Will I be able to sustain what I have learned from this intervention? What are the barriers that prevent me from achieving healthy diet and exercise? Am I more competent to relay information to my family regarding diet and physical activity? |
Improvement in diet and physical activity.
Increase in self-efficacy and motivation to have healthy diet and physical activity. |
No change in diet and physical activity, with the potential to worsen. |
| Students’ Families | Directly and indirectly served by intervention through dissemination of information from the students | Have I benefitted from this intervention?
Will I be able to sustain what I have learned from this intervention? What are the barriers that prevent me from achieving healthy diet and exercise? |
Improvement in diet and physical activity.
Prevention of diabetes; better management of diabetes with the knowledge from students. |
No change in diet and physical activity, with the potential to worsen. |
| Teachers | Primarily implementing program by teaching weekly classes and leading reflections, collecting journals | Are students effectively relaying information to their families?
Is this the most efficient use of my time? Do the students see and improvement in diet and physical activity? What are the barriers to my students achieving healthier diet and physical activity? |
Students are healthier, Teachers perhaps feel more motivated to teach.
Teachers gain new knowledge regarding barriers to behavior change that can perhaps be addressed at a classroom level. |
Regret regarding inefficient use of teaching time. |
| School Faculty (Principal) | Scheduling of special class time and hiring of appropriate staff to teach classes. | Are these lessons and activities benefiting the students on an academic level?
Is this an efficient use of my teachers’ time? Are there school level barriers to students achieving healthier diet and exercise? |
Students are healthier.
School gains new knowledge regarding barriers to behavior change that can perhaps be addressed at a school wide level. |
Regret regarding inefficient use of teachers’ time and resources. |
| Student and university faculty researchers | Design lesson plans and modules to train teachers; evaluate journals and reflections to assess the barrier to healthy diet and physical activity | What are the results of the intervention?
What are the barriers to students and students’ families achieving healthier diet and exercise? Is there a longterm reduction of diabetes? Is this an efficient way to deliver information to families regarding diet, physical activity, and diabetes? What can we do, moving forward, to remove some of these barriers that we discovered? Is this the most efficient way to uncover barriers to behavior change? Do students and students’ families actually change their behavior regarding diet and physical activity, and can this behavior change be sustained? |
Gain new knowledge regarding barriers; can then act on that to remove barriers through future interventions.
***Having trouble editing table; following text is for adjacent box***
Wasted time and resources in designing and implementing intervention. No new information gained regarding barriers to behavior change. |
|
| Community members | During intervention, could be involved in teaching lesson plans as guest lecturers.
Post intervention, could be involved by addressing barriers that arise (more specifics below) |
How can I collaborate with this intervention?
What barriers can I address? Are these new barriers? |
Can be involved in future interventions and help to remove barriers. | No new information gained. |
| Nutritionists, health specialists | Involved in advising researchers and teachers in best practices and information for healthy diet and exercise | How can I collaborate with this intervention?
What are the most important information points regarding diet and physical activity? Does educating students with this information enact behavior change in themselves and their families? |
Gain knowledge regarding effectiveness of certain lesson plans regarding behavior change.
Gain new knowledge regarding barriers. |
No new information gained.
Waste of time and resources in advising researchers and teachers. |
| School board | Agreeing to fund teachers and allotted time dedicated to weekly classes/research | Is this the most efficient use of time and resources (time of teachers, money spent, classroom time, etc.)?
Is this the most efficient way to uncover barriers to behavior change? Do the students see and improvement in diet and physical activity?
|
School gains new knowledge regarding barriers to behavior change that can perhaps be addressed at a school wide level.
Perhaps, student academic performance improves. |
Waste of time and resources. |
| University funding mechanism | Funds student and faculty researchers (could be grants, class credit for students, etc.) | Is this the most efficient way to uncover barriers to behavior change?
Is this the most efficient use of my resources in funding this student/faculty research?
|
Student and faculty achievements reflect successful funding decision.
Aid in improving student and community health. ***Having trouble editing table; following text is for adjacent box*** Waste of funding if no effect or no new information gained. |
|
| County government | Post intervention, could be involved in addressing barriers via changes to legislature | How can I collaborate with this intervention?
What barriers can I address? Are these new barriers? |
Can be involved in future interventions and help to remove barriers.
Can change policies to improve health of community. |
No new information gained. |
| Community organizations that address barriers (e.g. Athens Land Trust) | Post intervention, could be involved in addressing barriers via community based programs such as farmers markets | How can I collaborate with this intervention?
What barriers can I address? Are these new barriers? |
Can be involved in future interventions and help to remove barriers.
Can change current activities and interventions to reflect knowledge gained regarding barriers. |
No new information gained. |
| Government organizations that address barriers (e.g. SNAP or Dept. of Transportation) | Post intervention, could be involved in addressing barriers via changes to institutional structure (changes sidewalks or parks, policy regarding food stamps, etc.) | How can I collaborate with this intervention?
What barriers can I address? Are these new barriers? |
Can be involved in future interventions and help to remove barriers.
Can change current activities and interventions to reflect knowledge gained regarding barriers. |
No new information gained. |
The pilot study will be a one group pre-test/post-test design. Pre-test will occur immediately before the intervention and post-test will occur immediately after the intervention with a 6-month follow up test. Further interventions will be quasi-experiemental with matched control groups with pre- and post-tests of the same schedule.
Pilot:
O1 X O2 O3
Quasi-experimental:
Group 1A:
O1 X O2 O3
Group 2B: [control]
O1 O2 O3
Group 2A:
O1 X O2 O3
Group 2B: [control]
O1 O2 O3
Threats to validity:
Selection:
The pilot group experiences some threats to internal validity because of the lack of randomization. This group was chosen based on school and teacher interest in launching the pilot program so there is no comparison group and no matched control. This will be addressed in the further interventions as the pilot study is primarily used to fix any major problems with implementation.
Hopefully by using matched control groups, we can eliminate or at least be aware of some threats to internal validity. The groups will be as similar as possible – coming from the same age range, school system, and we will attempt to balance various demographic factors. Conducting a pre-test will provide information regarding similarity to be used for analysis.
Attrition:
Including pre- and post-tests will allow us to measure attrition so that we can determine if drop outs occurred because of a specific reason. If individuals who dropped out have similar pre-test results that are unique from the rest, then that can indicate a reason fro dropping out. Drop out is generally limited when tests are conducted within a school setting, especially because weekly activities will occur during the school day.
History:
Some students could receive information regarding diet and physical activity or could change their behaviors due to other activities, experiences, or influences outside of this intervention. This can be addressed with the use of multiple groups in different schools to test so that we collect a varied group of students who hopefully have experienced different histories.
Maturation:
Because we are testing middle school aged children, it will be expected that many physical and psychological factors will be different over the course of the school year and in the 6-month post-test simply due to students growing and maturing. To accommodate these changes, physical measures will be a secondary measure and other surveys and scales based on knowledge and behavior will be favored instead.
Testing effects:
Conducting the same or similar surveys and tests may change or improve students’ results of those tests; similarly, students may become more aware of the behaviors because of the tests and may participate in the intervention differently than without pre-test.
| Short-term or Intermediate Outcome Variable | Scale, Questionnaire, Assessment Method | Brief Description of Instrument | Example item (for surveys, scales, or questionnaires) | Reliability and/or Validity Description |
| Diet/nutrition knowledge
Physical activity knowledge Self-efficacy Motivation |
For parents:
“ewba Community Program” questionnaires (Gortmaker, 1999).
For students: Six section questionnaire developed by Fielder and adapted for middle school students (Fielder, 2008).
|
“ewba” measures knowledge related to diet and physical activity in the home via parent responses.
Six sections measure knowledge regarding diet and physical activity, motivations and attitudes (related to self-efficacy) and demographics. Each answer is allotted points and the amount of points determine if the student is healthy or knowledgable based on the provided score sheet. For motivations, each question corresponds to different motivations such as for health, for mood, for convenience, etc. This study will primarily look at “Factor 1 Health” motivations. |
What is the minimum number of days per week you believe a person must be physically active in order to receive any health benefit?
According to accepted recommendations, dietary fat should comprise what percentage of total calories? It is important for me that the food I eat on a typical day…takes no time to prepare. |
“ewba”:
Cronbach’s alpha parent scores: 0.13-0.78 Moderately reliable; limited availability of other measures. Good test- retest reliability. Six section test is a combination of many different questionnaires so the reliability of this specific questionnaire has not been tested. |
| * The pilot period will help to determine if this questionnaire is too complicated for those of middle school age. If so, the Youth Nutrition and Physical Activity questionnaire below can be used because it was developed for a 4th grade level. |
| Physiological Measurements
Height Weight Diabetes |
Collected in the Youth Nutrition and Physical Activity Survey below by nutritionist or nurse. | Height and weight of students will be recorded. Diabetes will be recorded as yes or no; family information regarding diabetes will also be collected. |
| Diet behavior
Physical activity behavior |
Youth Nutrition and Physical Activity Survey (Bea, 2014) | This survey was originally developed to assess the need for education interventions in Arizona schools regarding nutrition and physical activity. It is based on 24-hour recall questions and should be administered on Tuesdays-Fridays to assess weekday behaviors. | Yesterday, did you eat any vegetables?
On how many of the past 7 days did you exercise or take part in physical activity that made your heart beat fast and made you breathe hard for at least 20 minutes?
|
kappa statistic: 0.06-0.60 (Thiagarajah, 2008) |
Part V. Process Evaluation and Data Collection Forms
School enrollment form:
| School: | Teacher/Group: | Grade: | Number of Students: | Enrolled: (y/n) |
Student Test Tracking Form:
| Teacher/Group: | Student Name: | Pre-test: (y/n) | Post-test 1: (y/n) | Post-test 2: (y/n) |
Student Activity Completion Form:

Teacher Questionnaire:
Please answer each question fully.
Completion of Activities
Were you able to deliver all 16 lesson plans?
If not, which ones were you unable to complete and why?
Were you able to send all 16 pamphlets home with the students?
If not, which ones were you unable to send home and why?
Were you able to assign the weekly assignments for all 16 lesson plans?
If not, which ones were you unable to assign and why?
Integrity of Activities
Please rate the following components on a scale from 1 – 7, 1 being low to 7 being high. Please distribute your scores so that 5% are 1s, 10% are 2s, 20% are 3s, 30% are 4s, 20% are 5s, 10% are 6s, and 5% are 7s (Hansen, 1991).
1) Your enthusiasm towards the material in the classroom 1 2 3 4 5 6 7
2) The degree to which your delivery met the goals of the program 1 2 3 4 5 6 7
3) The degree to which you engaged all students 1 2 3 4 5 6 7
4) Your control of the classroom during delivery of activities 1 2 3 4 5 6 7
5) The students’ enthusiasm towards the material in the classroom 1 2 3 4 5 6 7
6) The students’ responsiveness to the material 1 2 3 4 5 6 7
7) The students’ degree of participation in the activities 1 2 3 4 5 6 7
8) The overall smoothness of the lessons 1 2 3 4 5 6 7
Evaluation of Barriers
Please answer the following questions after reviewing students’ journals. Keep journals on hand in order to reference them for the following questions.
What were the most commonly listed barriers to completing the activities (e.g. family could not afford, no access to food or space, family unsupportive, etc.) You may answer this questions with a tally for repeated barriers.
Week 1:
Week 2:
Week 3:
Week 4:
Week 5:
Week 6:
Week 7:
Week 8:
Week 9:
Week 10:
Week 11:
Week 12:
Week 13:
Week 14:
Week 15:
Week 16:
Were there any barriers that were specific to your school or community, or that dealt with particular community partners?
References:
Bea, J., et al. (2014). U.S. Dietary and Physical Activity Guideline Knowledge and Corresponding Behaviors Among 4th and 5th Grade Students: A Multi-Site Pilot Study. Retrieved from: http://www.joe.org/joe/2014june/rb3.php#top
Contento, I.R., et al. (2002). Review and Analysis of Evaluation Measure Used in Nutrition Education Intervention Research. Retrieved from: http://eds.a.ebscohost.com.proxy-remote.galib.uga.edu/eds/pdfviewer/pdfviewer?vid=2&sid=4fae8367-8de9-4c24-ad28-5db63aab9f37%40sessionmgr4002&hid=4108.
Fielder, C.R. (2008). Knowledge, Motivations, and Behaviors Regarding Eating a Healthy Diet and Physical Activity in Relation to Self-Esteem in College Students. Retrieved from: https://digital.library.txstate.edu/bitstream/handle/10877/3213/fulltext.pdf?sequence=1
Georgia Department of Public Health (n.d.). Online Analytical Statistical Information System. Available from http://oasis.state.ga.us/oasis/. Retrieved from https://www.stmarysathens.org/pdfs/about-us/2013CHNAandCHIP.pdf.
Glanz, K., Rimer, B.K., Viswanath, K. (2008). Health Behavior and Health Education. Retrieved from http://riskybusiness.web.unc.edu/files/2015/01/Health-Behavior-and-Health-Education.pdf#page=503.
Gortmaker, S.L., et al. (1999). Impact of a School-Based Interdisciplinary Intervention on Diet and Physical Activity Among Urban Primary School Children. Retrieved from: http://archpedi.jamanetwork.com/article.aspx?articleid=347688#ref-pnu8463-39.
Hansen, W., et al. (1999). Program Integrity as a Moderator of Prevention Program Effectiveness: Results for Fifth-Grade Students in the Adolescent Alcohol Prevention Trial. Retrieved from: http://ejournals.ebsco.com.proxy-remote.galib.uga.edu/Direct.asp?AccessToken=8UWU4PWV0NX1403X3FUW3FW0K194VP0UW3&Show=Object.
St. Mary’s Health Care System (2012-2013). Community Health Needs Assessment and Implementation Plan. Retrieved from https://www.stmarysathens.org/pdfs/about-us/2013CHNAandCHIP.pdf.
Thiagarajah, K., et al. (2008). Validating the food behavior questions from the elementary school SPAN questionnaire. Retrieved from http://www.ncbi.nlm.nih.gov/pubmed/18725149.
University of Wisconsin Population Health Institute (2013). County Health Rankings and Roadmaps. Retrieved from http://www.county healthrankings.org/app/#/Georgia/2013/Clarke/county/ outcomes/overall/snapshot/by-rank
U.S. Department of Health and Human Services, U.S. Department of Agriculture (2015). http://health.gov/dietaryguidelines/2015/guidelines/chapter-3/social-ecological-model/