
SCHOOL-BASED PROGRAM PROMOTING NUTRITION ACTIVITIES
Community Guide Update and Rationale for Intervention
Table 1: Updated recently interventions about school-based programs promoting nutrition
| Author & Year | Intervention Setting, Description, and Comparison Group(s) | Study Population Description and Sample Size | Effect Measure (Variables) | Results including Test Statistics and Significance | Follow-up Time |
| Cohen, et al., 2014 | The CHANGE study selected eight rural elementary schools at four states to participate two-year randomized healthy lifestyles intervention. The students were provided healthier school breakfasts and lunches and exposed to the special healthy style curricular and messages. Parents and community outreach components also involved to enhance the changes of students both during and after school. Four schools were randomly selected as control group. | Students from grades 1 to 6 attending the eight selected schools were eligible for the study. 432 students (251 in intervention groups and 181 in control groups) were included in the analysis. | Outcome measures were included:
– The consumption information of the past 24-hours for forty-one commonly consumed foods and beverages and their portion sizes -The estimated consumption of food groups, saturated fats, fiber, added sugars, and the overall glycemic index. Those variables were measure before and after the intervention at both groups. |
After two-year study, the students in CHANGE intervention consumed:
– More vegetables (0.08 cups/1000 kcal/day, p=0.03) – More combined fruits and vegetables (0.22 cups/100 kcal/day, p<0.05) – Less dietary glycemic index (GI=-1.22, p<0.05) -No other differences were found. |
-Baseline measure: Spring/Fall 2008
-Post-intervention measure: Spring 2009 Follow-up time:6 to 12 months. |
| Puma, et al., 2013 | A long-term quasi-experiment using the Integrated Nutrition and Physical Activity Program (INPAP) grounded social cognitive theory and Piaget’s cognitive development was conducted at a rural low-income school district at Colorado. The outcome variables were measured in four consecutive springs when students were from fifth to eighth grade. | -Students who were in second grade in the fall 1999 and did not receive the INPAP were eligible for the control cohort (n=190).
– Students who were in the second grade in 2000 and received the INPAP curriculum for 2 years were eligible for the intervention cohort (n=173). |
The outcome measurements were included:
-Classroom surveys: knowledge, self-efficacy, food references, and attitudes. -Writing samples: attitudes and the ability to apply knowledge to healthy eating and physical activity. -Body mass index: height and weight. |
-Classroom surveys about nutrition outcomes, the intervention cohort answered/responded:
+Grade 5: more correctly about the Food Guide Pyramid (p<0.001) and the recommended numbers of daily needed fruits and vegetables (p<0.001) +Grade 6 to 8, the knowledge about number of fruits and vegetables consumed daily persisted despite slightly decrease in percentage of correct answers in the intervention cohort. + More likely to correctly identify healthy food (p<0.05) and read facts on food label (p<0.05) + More likely to believe the present consumed food can affect now and future health (p<0.01) and value their future health as an adult (p<0.05) +More like to plan for fruit consumption in a day or at breakfast (p<0.01). -Classroom surveys about physical activity-related outcomes: control group had a higher score than the intervention (p<0.05) -Writing samples: there were no significant differences between two cohorts (p>0.05). -BMI: at grade 2, the percentage of overweight or obesity increased about 10% in the intervention and 20% in the control cohort. |
-Follow-up time:
+1st: 3 years +2nd: 4 years +3rd: 5 years +4th: 6 years (Total 6 years of follow-up) |
| Hoffman, et al., 2010 | A school-based fruit and vegetable promotion program with multiple settings including lunchroom, classroom, school-wide, and family components was conducted at four public schools in a large, urban school district in the Northeastern U.S. The information to promote fruit and vegetables consumption was delivered through messages, symbolic and live role modeling. Two schools were randomly chosen as the control. | All kindergarten and first grade children studying at the four selected schools were eligible for participating in the study (n total =297, n in intervention group=149, n in control group= 148). | The outcome measurements are fruit and vegetable consumption at lunch by assessing weighed plate waste, children perceptions, child vegetable and fruit preferences, and BMI. | – Most children heard and liked the announcement a lot (98% and 78%, respectively.)
-After controlling for pre-intervention preferences, there was no significant differences between the intervention and control groups in fruit preference (p=0.85 in the first years, p=0.50 in the second year), and in vegetable preferences (p=0.69 in first year and p=0.99 in second year). – Children in intervention group consumed more fruits than in control group in both two-year study (year 1: 29 more grams of fruits/lunch, p<0.001; year 2: 21 more grams of fruit/lunch, p<0.005), but the vegetable consumption only significantly increased in year 1 (6 more grams, p<0.01.) |
-Pre-intervention measurement: Winter 2005
-After intervention measurement: +Spring 2006 +Spring 2007 First follow-up time: about 3 months Second follow-up time (from the first): about 12 months Total follow-up time: 15 months |
Updated evidence and comparison to The Community Preventive Services Task Force’s recommendation
Three recently articles about the evaluation of school-based interventions to promote nutrition and physical activities that are reviewed above show that the interventions have inconsistent results. Therefore, there is insufficient evidence to make a recommendation against or for the school-based intervention to promote healthy lifestyle.
- According to the systematic review of total forty-one studies with the time-frame from 1966 to 2002, the Community Preventive Services Task Force finds out that there is also insufficient evidence to establish a recommendation for the enhancement of fruit and vegetables consumption by multi-component school-based nutrition interventions.There should be no change in the recommendation of the Task Force. Based on the result of Task Force’s review, the changes of behavioral outcomes are small and there is existence of the high level of potential bias, so there is no clear benefit of the school-based intervention. All of the three articles reviewed in the table 1 show both the significantly positive and non-significant effects.
- Cohen and colleagues found out some effectiveness of the intervention. By a multi-component intervention, the low-income rural children in the intervention group consume more vegetables or combined fruits and vegetable at the significant increase (p<0.05) when compared to the control group after one-year study. Also the dietary glycemic index in the children exposed to the intervention is significantly less than the children in unexposed group (Cohen, et. al., 2014). Puma’s study also shows that the intervention can help students have an improvement of knowledge about the Food Guide Pyramid and the numbers of daily needed fruits. The intervention also makes positive changes in the children’s behavior and attitude (Puma, et al., 2013). In Hoffman’s study, the fruit consumption in the intervention group significantly increases after two-year follow-up (p<0.005) (Hoffman, et al., 2010).
- Nevertheless, the vegetable consumption only significantly increases in the first year, and no longer significant increases in the second year (Hoffman, et al., 2010). The fruit preferences are not different in the intervention from the control group when the pre-intervention preferences were controlled (Hoffman, et al., 2010). Moreover, Puma figured out that control group even has significantly higher score in physical activities than the intervention group (p<0.05). He also presented that the intervention has similar scores for attitude and behaviors about health food and physical activities (Puma, et al., 2013). Cohen pointed out that the intervention group has no difference in whole grain, legumes, diary, potatoes, added sugar, and dietary fiber’s consumption as compared to the control (Cohen, et al., 2014).
- To sum up, the benefits of school-based intervention program to promote healthy lifestyle are still inconsistent. Hence, there is no change needed in the recommendation of the Task Force.
Theoretical Framework/Model
The Theory of Planned Behavior can fully present the three main constructs that affect the behavior to promote a healthy lifestyle: attitude toward behavior, subjective norm, and perceived behavioral control. The stronger children or students have behavioral intention about changing their eating habits, the more likely they will actually practice the healthy lifestyle. For example, Puma study shows that the intervention program helps to improve children’s knowledge such as identifying health food or number of daily needed fruits. It means that when the knowledge is enhanced, the attitude toward behavior may change and lead to a positive outcome. As a result, children in the intervention group are more likely to plan for fruit consumption in a day or at breakfast (Puma, et al., 2013). One of the interesting point from this model is that it hypotheses an ultimate effect from the interaction of the consecutive three constructs to behavioral intention, not a single construct or two of three constructs.
Three constructs of the Theory of Planned Behavior:
Attitude toward behavior: When the participants can understand benefits or positive outcomes they can gain from a new behavior, they will tend to change their behavior. Therefore, depending on whether students believe or not that eating healthy food or doing more physical activities can help them achieve better health in the future affects on whether they should change their lifestyle. In addition, clear and strong evidence of benefits from changing lifestyle such as reducing the risk cardiovascular, diabetes, or obesity disease is also a strong factor that encourages students for new behavior. More than 50% children had no worried about foods (COI, 2007). Children do not care much whether the food they eat are healthy or not. Besides, children’s attitudes about healthy food can be strongly affected by attitudes of their parents, teachers, and friends. Eighty four percent of children agreed that their parents made them eat healthy food (COI, 2007). In general, children can recognize the important role of healthy food. Most children agreed healthy food is important (82%) and helps them have a better health (95%) (COI, 2007). Seventy percent children thought they should eat 5 portions of fruit and vegetables per day (COI, 2007).
Subjective norms: We need to know that our target population accept or not the change in their behavior. Most children understand that eating healthy food is necessary and important. However, our population is very young children. It means that at currently time of intervention, they have a small risk of disease and they cannot even recognize which potential diseases are or understand how serious they will be. Therefore, the normative belief in this theory is not very helpful. In contrast, the motivation to comply part of the model works very well in this situation. Children are easily impacted by behaviors of others people around them. In other word, children tend to mimic from the ones considered as standard role models. For example, eating healthy food behavior from a super excellent senior student can encourage younger students to change their choosing food options. In addition, receiving praise and compliments is a great motivation only for that student to keep that behavior, but also for other students to change their behavior to choose healthier food. This is because other students also want to receive similar compliments from their teachers, parents, or friends. Hence, However, a motivation from their teachers, symbolic and live role modeling, or healthcare professionals encourages students to accept the change in their daily lifestyle.
Perceived behavioral control: This means whether a person can perceive that he or she has enough ability to change his or her behavior. In the Theory of Planned Behavior, this construct is presented through control beliefs and perceived power. When schools provide breakfast or lunch with healthy food, the schools should make students realize that they can have option or ability to choose or try healthy food instead of their usual ones which may not very healthy. The role of intervention program is to determine what should be done to improve the students’ realization about this ability. Nevertheless, when the school conduct the intervention program, they can change their usual food into healthier one. This will make children reduce their control over their meal. Children can also have some other alternative ways to deal with if they do not like the food. For example, they may skip the main meal, if the meal is healthy food they do not like, and they can buy more snacks to eat instead. They can have other options to brings their own meals. Or they also can eat only meat or rice or noodle, and leave the fruits and vegetables. Students can choose to consume only one fruit or vegetable, instead of eating all different fruits and vegetables provided.
Outcomes: Attitude toward behavior, subjective norm, and perceived behavioral control are main factors that directly impact to behaviors. In the school-based intervention program, our goals are to increase the consumption of fruits and vegetables and physical activities.
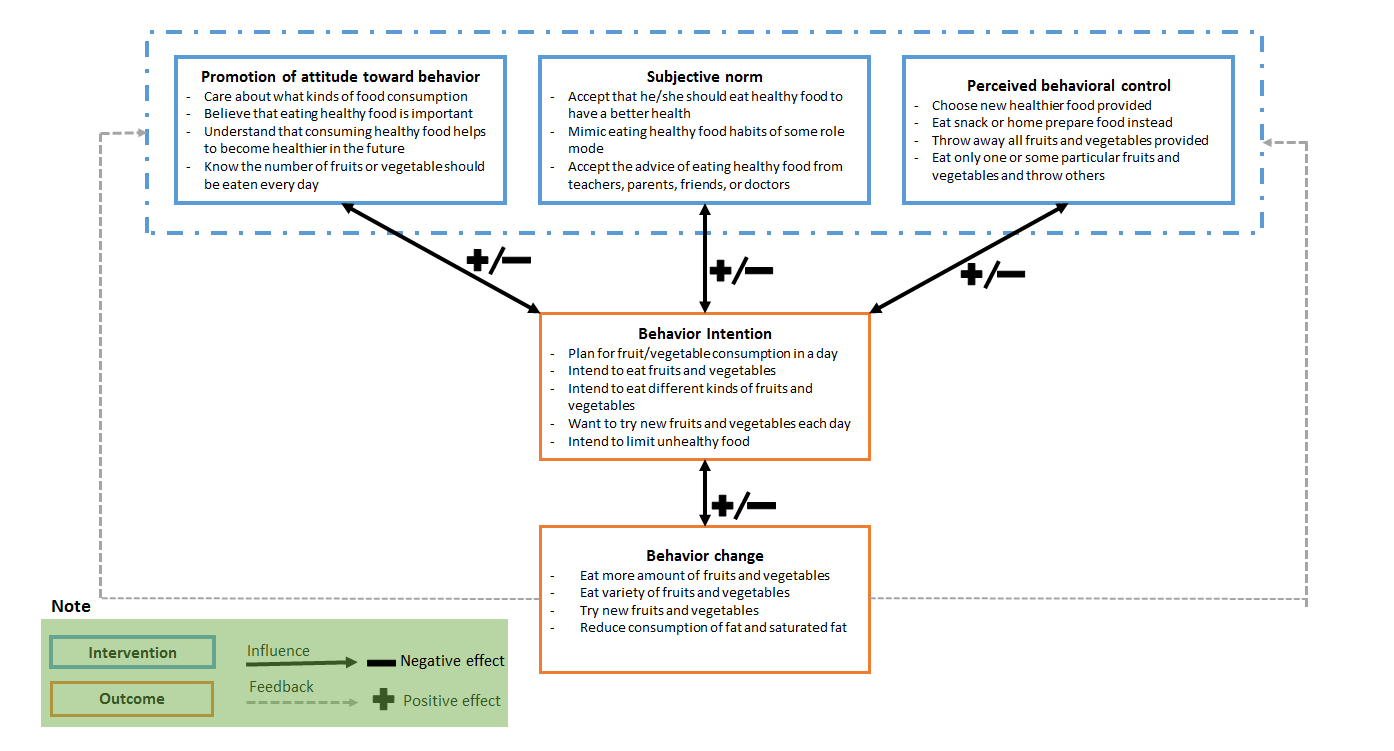
Figure 1: The conceptual model of the Theory of Planned Behavior about healthy diet
Logic Model, Causal and Intervention Hypotheses, and Intervention Strategies
Target population
Our target population is students grade from 1 to 8 from low social economic status families. We highly focus on non-White student population. Studies shows that Blacks had significantly less fruit and vegetable consumptions than Whites with poorer health outcome. After controlling for other characters, Blacks consumed 0.42 fewer combined daily servings of fruits and vegetables than Whites (P<0.001). According to Behavioral Risk Factor Surveillance Survey, African Americans have the lowest percentage of fruit and vegetable consumption (only 21.3%) (Satia, 2009). And persons who are from poor income families consumed less servings than the high-income ones (P<0.001) (Dubowitz et al., 2008). Darmon showed that persons in high socioeconomic status are more likely to consume health food including whole grains, lean meats, fish, low-fat dairy products, vegetables, and fruits (Darmon & Drewnowski, 2008). Moreover, Black and Latino children have higher BMI scores than White children (Guerrero et al., 2016). African Americans have higher rate of cancer and more server high blood pressure, and they are more likely to develop hypertension at earlier age (Satia, 2009).
Program setting
Public elementary and secondary schools in rural areas will be chosen to conduct multiple component intervention. In particular, the program will target on schools with high percentage of non-White and low-income students. Therefore, the program can intervene the fruit and vegetable consumption at the most health disparate group.
Table 2: The Intervention Methods and Strategies
| Intervention Method | Alignment with Theory | Intervention Strategy |
| Increase knowledge about benefits of eating healthy food | This intervention method is based on the attitude toward behavior of Theory of Planned Behavior concepts (TPB). Children may not worry about their food because they do not recognize and understand or misunderstand about healthy food. When children’s knowledge is strengthened or broadened through providing education about benefits of healthy food and bad consequences of potential diseases caused by unhealthy food consumption, we will be able to affect their behavioral belief into a positive direction. Since then, this method can impact on children’s attitude, make them care more about their daily food, and ultimately lead to change their eating habits or food choices. | – Provide weekly lessons about how healthy food works to help them have better health
-Provide lessons with vivid examples about how bad or serious potential diseases. -Provide statistics evidence in a simple way to illustrate the likelihood of getting those bad diseases when eating unhealthy food and the likelihood of preventing those consequences through applying a healthy lifestyle. |
| Increase knowledge about how to eat healthy | This intervention method is also arisen from the attitude toward behavior of the TPB concepts. A correct understanding may be more likely to result in a positive outcome/action. Children may agree that eating healthy food can be healthier in the future. But they may not know how to eat healthy or misunderstand that their currently bad eating habit is already good one. So in this step of intervention, we will correct or adjust wrong attitudes and help to establish appropriate attitudes toward eating healthy food among children. | -Provide courses about the Food Guide Pyramid, what food belongs to healthy food groups, number and amount of fruits and vegetable that should be consumed daily.
-Guide children to read the facts on food labels. -Put posters or photos of healthy food around classroom, lunch room, or cafeteria. -Test children’s understanding through small and quiz, and continue to correct any remain misunderstanding. |
| Promote motivation through social impacts | The TBP concepts of motivation to comply are basic foundation for this intervention method. Children’s behaviors are strongly impacted by external influences, especially from classmates. Children also tend to imitate behaviors which are considered good because they want to become good students or receive complements. If we build healthy food consumption to become as an image of the standard of living, that trait can become an effective tool to promote children to change eating behaviors. When we continue using this strategies, we can encourage students to keep complying this behavior. | – Use symbolic and live role modeling
– Provide advice from teachers or healthcare professional – Give verbal praise to students eating fruits and vegetables – Hold group discussion among children and children and teachers to share their stories, feeling, and experience of eating healthy food behaviors. – Repeat healthy lifestyle messages daily. |
Promote action or decision of choosing healthy food to eat |
TPB suggests that the intervention subjects need to recognize that the behavior change is under their control in order to increase the intention of changing into good eating habits. When school provides healthier food for students’ breakfast or lunch, we can see that children do not completely control their meal. Although students do not prepare the meal themselves, they still can have some basic controls: trying new healthy food or still keeping their own habits of eating as usually. Therefore, this method of intervention still works well to make students perceive their power and have control belief about the program. | -Provide additional options that contain healthy food for school breakfasts and lunches:
+ Offer whole grain daily +Provide multiple fruits and vegetables daily. +Add more vegetables and fruits into food recipe +Use healthy food ingredients to cook meals + Supply low-fat or nonfat milk daily |
Table 3: The logic model for the program
| Inputs/Resources | Activities | Outputs | Short-term Outcomes | Intermediate Outcomes | Long-term Outcomes |
| -Funding for buying healthy food (variety of fruits, vegetables, whole grains, non-fat milk…), educational material, videos, posters, training school-chefs and teachers about program.
– Personnel includes: teachers, food service staffs, healthcare counselors, living role models (coach, excellent students) – Space includes: classrooms where hold lectures and group discussion, lunchrooms, cafeterias, canteens where will provide the healthy food, and wall where will be hung posters or photos. -Partnership with local elementary and secondary schools. |
– Provide weekly lessons about how healthy food works to help them have better health
-Provide lessons with vivid examples about how bad or serious potential diseases. -Provide statistics evidence in a simple way to illustrate the likelihood of getting those bad diseases when eating unhealthy food and the likelihood of preventing those consequences through applying a healthy lifestyle. -Provide courses about the Food Guide Pyramid, what food belongs to healthy food groups, number and amount of fruits and vegetable that should be consumed daily. -Guide children to read the facts on food labels. -Put posters or photos of healthy food around classroom, lunch room, or cafeteria. -Test children’s understanding through small – Use symbolic and live role modeling – Provide advice from teachers or healthcare professional – Give verbal praise to students eating fruits and vegetables – Hold group discussion among children and children and teachers to share their stories, feeling, and experience of eating healthy food behaviors. – Repeat healthy lifestyle messages daily. -Provide additional options that contain healthy food for school breakfasts and lunches: + Offer whole grain daily or multiple fruits and vegetables daily + Supply low-fat or nonfat milk daily |
– 5 rural elementary and secondary schools chosen to participate the program.
– Handbooks provided to every intervention student about fact sheet of healthy food benefits, knowledge of eating healthily, and additional statistic of likelihood of potential diseases. -Videos: +1 video about healthy food benefits +1 video about an introduction of potential disease (obesity, diabetes, cardiovascular diseases) + 1 video about guiding how to recognize and eat healthy food. Each video has time length about 15 to 20 minutes. – 50 posters about Food Guide Pyramid and 50 photos of healthy food around: one in every classroom, lunchroom, cafeteria/canteen. – 20 weekly lessons with length for 60 minutes with directions of teachers or health counselors with 15 minutes of group discussion among children. – 5 quiz: one/4 weeks to check students’ understanding. – 5 minute messages provided daily during lunch or breakfast hours for 20 weeks. -Each school, using three live role models: one coach and two excellent students to share personal stories and experience for 10 minutes. -50 trained educators (10 educators per school). – Target number of student participating is |
Attitude
-Increase the care and worry about types of food consumption daily. -Increase the care for future health. – Increase knowledge of benefits of eating healthy food – Increase knowledge about eating healthy. -Increase in recognition of healthy food. Subjective norm
-Increase number of children imitating their friends’ healthily eating behaviors. -Increase the number of children who receive the praise day by day. -Increase motivation to keep good healthily eating habits and encourage other students to imitate the good habits. Perceived behavioral control – Enhance the belief of their |
-Increase the amount of fruit and vegetable consumption daily
-Increase the number of fruit and vegetable consumption. -Increase whole grain and non-fat milk consumption. |
-Reduce in rate of obesity or overweight, cardiovascular diseases (hypertension, heart attack), and diabetes
Intervention hypotheses -Weekly lessons about impacts of healthy food on health will lead to increases in children’s care and worry about types of food they consume and enhancements in knowledge of benefits and eating healthy food. -Lessons about how bad or serious potential diseases will lead to increases in caring for future health. -Statistics evidence illustrating the likelihood of getting bad diseases when eating unhealthy food and the likelihood of preventing those consequences through applying a healthy lifestyle will lead to increases in the care of types of food consumption and the care for future health. -Courses about the Food Guide Pyramid, what food belongs to healthy food groups, number and amount of fruits and vegetable that should be consumed daily will lead to increase in knowledge of eating healthily. -Lessons about guiding children to read the facts on food labels will lead to increases in knowledge of eating healthily. |
Intervention hypotheses
-Putting posters or photos of healthy food around classroom, lunch room, or cafeteria will lead to increases in recognition of healthy food.
-Testing children’s understanding through small quiz about knowledge of how to eat healthily, and continuing to correct any remain misunderstanding will lead to improvements in knowledge about eating healthy lifestyle.
– The four interventions which include using symbolic and live role modeling, providing advice from teachers or healthcare professional, holding group discussion among children and children and teachers to share their stories, feeling, and experience of eating healthy food behaviors, and repetition of healthy lifestyle messages daily as a way of reminding will lead to increases in intention to eat healthy food, plan to prepare th the number of children who imitate other children’s behavior of consuming healthy food daily, and eat variety of fruits and vegetables daily and the number of children receiving praise day by day.
– Giving verbal praise to students eating fruits and vegetables will lead to increases in motivation to keep good healthily eating habits at children who have already consumed vegetables and fruits, and encouragement for other students to imitate the good habits.
-Providing healthy food at school’s food services as an additional food-choice option will lead to increases in the belief of their ability to change their eating habit.
Causal hypothesis
Based on the Theory of Planned Behavior, the goals of our interventions are to promote positive attitudes, enhance subjective norms, and stimulate perceived behavioral controls in order to results in a change in consuming healthy food. Increases in the worry about types of food consumption, the care for future health, knowledge about eating healthily, and abilities to recognize healthy food as well as the increases in intention to eat healthily, to prepare healthy food daily, and to eat variety of fruits and vegetables, and the enhancement of the belief of their ability to change into healthy eating habit will increase the amount and number of fruit, vegetable, whole grain and non-fat milk consumption. Changing in those healthy eating behaviors will decrease rate of obesity or overweight, cardiovascular diseases, and diabetes in our intervention population in the future.
The SMART outcome objective
Goal 1: Increase knowledge about benefits of eating healthy food
Objective 1: After 20 weeks of intervention, the percentage of students who care and worry about types of food consumption daily will be more than 80%.
Objective 2: After 20 weeks of intervention, the number of students who care for future health and potential diseases will increase into 70%.
Objective 3: After 20 weeks of intervention, more than 80% of students will pass the test about understanding of benefits of eating healthy food.
Goal 2: Increase knowledge about how to eat healthy
Objective 1: After 20 weeks of intervention, more than 75% of student will answer correctly at least 70% questions about how to eat healthily.
Objective 2: After 6 month-follow-up, the percentage of student who answer correctly at least 70% questions about how to eat healthily will remain above 60%.
Objective 3: After 20 weeks of interventions, at least 85% of students can distinguish correctly 90% of the healthy and unhealthy food.
Goal 3: Promote motivation through social impacts
Objective 1: After 10 weeks of intervention, the percentage of children intending to eat healthy food will increase into 70%.
Objective 2: After 20 weeks of intervention, there will be at least 75% of children who intend to prepare healthy food for breakfast or lunch.
Objective 3: After 20 weeks of intervention, the number of children who intend to eat at least 3 different kinds of fruits and 5 different kinds of vegetables per day will be more than 80%.
Objective 1: After 20 weeks of intervention, the number of children imitating other students’ eating behavior will increase will be at least 60% of the total participants.
Objective 2: After 20 weeks of intervention, the percentage of children receiving praise will be more than 60%.
Goal 4: Promote action/decision to choose healthy food to eat
Objective 1: After 20 weeks of intervention, there will be more than 75% of students who choose the healthy food meals provided by the schools.
Objective 2: After 6 month-follow-up, at least 70% students will still choose to eat healthy food meals provided by the schools.
Objective 3: After 1 year-follow-up, the number of children who will choose to eat healthy food meals will be 65%.
Evaluation Design and Measures
Table 4: The major stakeholders and the program’s effects on the stakeholders
| Stakeholder | Role in Intervention | Evaluation Questions from Stakeholder | Effect on Stakeholder of a Successful Program | Effect on Stakeholder of an Unsuccessful Program |
| Students grade from 1 to 8 | Program participants served by the program | -How will the program affect my attitude, knowledge, and behavior of eating healthily?
-What can I gain from the program? -What are potential bad consequences/effects I may get when I participant in the program? |
-Increase in knowledge about the benefits of healthy food, ways to eat healthily, and care for future healthy and current food consumptions.
– Change into healthily eating practices which will help to reduce risk of potential diseases (obesity, diabetes,…) and achieve a better health. |
-No change in knowledge, attitude, behaviors about healthy food.
-No decrease in risk of potential diseases related to unhealthily eating habits. |
| Teachers /Healthcare counselors | Implement program | – How can I participate in the program?
– How much time do I need to spend for the program? -What skills or knowledge do I need to have to participate in the program? -What will the program affect my job? -What is the likelihood of the program to succeed? |
-Increase skills and knowledge to conduct an intervention program about diet.
-Increase confident in the program. -Feel more confident and willing to conduct similar programs in the future. -Feel satisfied about program’s achievements. |
-Disappointed about the program.
-Unwilling or being discouraged to join similar programs in the future. -Feeling lack of skills to persuade students to change their eating habits. -Learn how to improve the program |
| Living role models (Coach and excellent students) | Implement program | -How can I participate in the program?
-How can the program affect my reputations or students’ attitude about me? -What is the value that I and other students can receive? |
-Feel confident in public speaking.
-Keep maintaining healthily eating habit. -Feel pleased about the efforts spent for the program -More willing to support other intervention program |
-Feel disappointed about the program.
-Lack confident to join similar program -May feel that it is not worth to spend on the program. |
| Food service staff | Implement program | -What do I need to know before joining the program?
-How much more time do I need to spend to prepare additional healthy food daily? -How can I change my daily working process of making meal? |
-Enhance skills and knowledge of preparing healthy meals.
-Be more willing to keep cooking healthy meals to provide for students or cook new recipes with healthy food. |
-Feel that the program wastes time and efforts.
-Wonder whether the meals with healthy food is not as good as the regular recipes. -Lose confidence in cooking healthy meals |
| Parents/ Community outreach | Support the program | -How can I support the program to promote healthily eating habits in my children/students?
-What skills and knowledge do I need to have to support or answer children’s questions? -How can I prepare healthy meals at home or assist my children to prepare? |
-Satisfy when children change into good eating habits.
-Confident to assist other similar program to help their children be healthier or study better. -Encourage other parents to join other programs |
-Feel waste of time and efforts.
-Not willing to let their children to participate other intervention programs |
| Funding organization | Implement program | -What values can we earn from program?
-What is cost-effective evaluation for the program? -How can we know the program is successful or not? -How much estimated money is needed for the program? |
-Confident to continue to support the intervention program or provide funding if there is a need of expansion the program. | -Lack of confidence to continue to support the program or other similar intervention program. |
The evaluation design
The outcome evaluation design: Randomized control community- and school-based intervention.We conduct a twenty-week randomized, controlled community- and school-based healthy food behavior intervention at elementary and secondary students from low social economic status families. There is one intervention group with multiple activities and one control groups.
The scientific notation:
R O1 X O2 O3 O4 (Intervention group)
R O1 O2 O3 O4 (Control group)
Note:
O1: pre-test, O2: post-test at 20 weeks, O3: post-test at 6 months after intervention ends; O4: post-test at 1 year after intervention ends.
The unit of the randomization is at school level. This will help to prevent a contamination among students between the intervention and control groups. The students in the intervention group will receive an educational curriculum every week, take a quiz each 4 weeks, expose to living role model and healthcare professional’s story and advice, expose to healthily eating messages daily, have group discussions, receive verbal praise, and access to a healthy food service component. The students in the control groups will not receive any intervention activity, which means that students will continue with regular school education.
Pre-test will be measured at one week before the intervention. Three post-tests will be administered at the last day of intervention, six months after intervention, and one year after intervention. The time of pre-test and post-test in the control group is the same as the intervention group. Both pre-test and post-tests will measure students’ care about food consumption, knowledge of benefits of eating healthy food, knowledge about eating healthily, recognition of healthy food, the number and amount of vegetable, fruit, whole grain, and non-fat milk consumption daily.
Following is the major threats to the internal validity:
Selection bias: students who agree to participate to the study or whose parents also agree for their children to participate may have more interest or more care about food consumption so they are more likely to comply well with program or change their behaviors. Participants also already recognize the importance of eating healthily because those students have family members who get chronic diseases related to unhealthy lifestyle. That may lead to differences among students who participate in the program and one who do not. To minimize this selection bias, the program should try to enroll as many students in both intervention and control school as possible. In addition, the selected schools should be no significant differences in baseline characteristics, including: the ratios of sex, race, and social-economic status.
Attrition bias: our program is a long-term intervention and follow-up. Some students may think that the program takes them so much time or joining in the program may affect their regular study schedule or exams. Therefore, high percentage of drop-out is a serious threat to the internal validity in the prospective study, especially when there is a differential drop-out the between the intervention and control groups. To reduce drop-out, participants’ personal identifying information and also parents’ information should be carefully collected. Furthermore, to encourage participants to remain in the study, some incentives such as free meals are provided weekly during the intervention, and monthly during one year after the intervention.
Instrumentation bias: when outcomes are collected, the interviewers may have different behaviors between the intervention and control groups. This may lead to unreliable or skewed results which do not reflect correctly the efficacy of the intervention. For examples, the interviewers may ask more carefully in the intervention groups or interpret the answers differently. Hence, the interviewers should be trained and follow a strict protocol. The interviewers should also be masked with the status of the participants, which means they do not know which groups the interviewees belong to. The participants also try to stick with social norm. It means that they tend to answer in a way to make themselves look better. Therefore, the questionnaire should be designed to ask questions in different ways.
Table 5: Summary of Measures
| Short-term or Intermediate Outcome Variable | Scale, Questionnaire, Assessment Method | Brief Description of Instrument | Example item (for surveys, scales, or questionnaires) | Reliability and/or Validity Description |
| Attitude toward behavior
-Knowledge about benefits of eating healthy food – Knowledge about how to eat healthily |
Classroom survey (Auld, Romaniello, Heimendinger, Hambidge, & Hambidge, 1998, 1999) | The survey evaluates knowledge of the Food Guide Pyramid and attitude toward fruits and vegetables and school lunches (5-point Likert Scale) | -Knowledge about healthy food: Children were asked to (1) write in the name of food groups from a list onto a blank Food Guide Pyramid; (2) select which food (from a list) would increase fruit or vegetables or whole grains given a sample meal; (3) select which food group from a pair (three pairs total) the Food Guide Pyramid says you should eat more of (Auld et al., 1998).
-Indicate their agreement with statements about school lunches, fruits, and vegetables. |
Test-retest reliability is 0.72 of knowledge for the Food Guide Pyramid and 0.73 for attitudes toward fruits and vegetables |
| Motivation through social impacts | Acceptability questionnaires (Hoffman et al., 2010) | -A 10-item acceptability questionnaire using a six-point scale (1=strongly disagree; 6=strongly agree) was used to evaluate the perceptions of lunch aides about the lunchtime component.
-A 17-item questionnaire using the same six-point scale was used to evaluate teachers’ perceptions. -Children answered a brief questionnaire. The questionnaire could be answered in both open and closed-ended responses. For closed ended questions, answers were in a three-point pictorial rating scale. |
-Lunch aides perception about stickers “Giving stickers to students when they eat their fruits and vegetables during lunch is a good way to help them eat more fruit and vegetables.”
-Teachers’ perceptions: “The fruit and vegetable stickers are an acceptable way to encourage students to eat more fruits and vegetables during the school lunch.” -Children’s perception: “How much do you think the stickers help you eat your fruit and vegetables at lunch?” |
-For lunch aides, the acceptable internal consistency α=0.85
– For teachers, the acceptable internal consistency α=0.89 |
| -Perceived behavior control
+Confidence in their ability to control the behavioral change |
Classroom survey (Auld et al., 1999) | A number of additional items were grouped into self-efficacy indicators as confidents to prepare foods or eat five or more servings of fruits and vegetables a day. | Attitude toward their ability to control behavioral change:
+Self-efficacy (food preparation) +Self-efficacy (eating more fruit and vegetables) |
-Test-retest reliability is 0.72 for their confidence in their own ability to prepare food or eat five or more servings of fruits and vegetables a day. |
| -Action to choose healthy food to eat
+Number and amount of healthy food (vegetables, fruits, whole grains, low-fat milk…) |
– 2007 Block Food Screener for age 2-17 years (Cohen et al., 2014; Hunsberger, O’Malley, Block, & Norris, 2015)
– Plate Waste method (Auld et al., 1999). |
The Block Food Screener is a questionnaire which can be administered in 10-20 minutes. The questionnaire collects consumption information for commonly consumed foods and beverages and their portion sizes. Children can be self-answered themselves or with the assistance of parent or caregiver.
The questionnaire measures the intake of fruit, vegetables, dairy, whole grains, protein sources, saturated fat and sources of added sugars. -Plate Waste: visual estimates were used to quantify the amount of fruits and vegetables consumes at school lunch |
Examples of predetermined dietary variables:
-Fruit/fruit juice (cup equivalents) – Vegetables excluding potatoes and legumes (cup equivalents) – Potatoes, including French fries (cup equivalents) -Sugar/syrup added to foods/beverages during processing/preparation (teaspoon) (Examples of questions is not available) -When lunchroom trays were returned, evaluators separated and labeled trays of the participants. The proportion of fruit and vegetable servings was evaluated as none, trace, one-quarter, one-haft, three-quarters, all but a “bite,” all. (Auld et al., 1998) |
– Relative validity: The correlation between data obtained from the Block Kid Food Screen and the Food Frequency Questionnaire was corrected for the within-subject variation in food intake reported by the 24-h recalls using standard nutritional assessment methodology. According the assessment of Bland-Altman plots, there is no systematic difference between two instruments for the following outcomes: vegetables, diary, and meat/fish/poultry fat consumption (Hunsberger et al., 2015).
-For the Plate Waste method: inter-observer agreements on plate waste were above 0.85 at six time points (Auld et al., 1999). |
Process Evaluation and Data Collection Forms
- Recruitment and enrollment– School recruitment: Schools’ committees will receive letters to be invited for participating in a school-based program intervention
Healthy meal promotion program in students
School Recruitment Letter
Dear ________________,
The University of Georgia School of Public Health would like to invite your school to be part of a healthy meal promotion program for students grades from 1 to 8. Your school will be randomly assigned as an intervention group, which is implemented healthy diet educational curricular and provided healthy meals for students, or as a control group, which has no intervention activities. The goal of this program is to evaluate the efficacy of the school-based intervention with ultimate aim to promote healthy diet among students.
If you are interested in participating in this program, we would like to invite you to The University of Georgia Health Science Campus, Room __ Rhodes Hall on June 6th, 2016 at 6pm to learn more detail about our program.
Please call us at 706_______ or mail to healthymeal@uga.edu for any questions.
Sincerely,
Healthy Meal Promotion Coordinator
The University of Georgia School of Public Health
-School Enrollment Form
School Name Address School Contact Name Contact Phone Number Contact Email Address Total number of students grade 1 to 8 -Student recruitment: This is a letter to invite student to participate into the study. In selected schools, the form will be delivered to eligible students at classrooms and suggest them to take home to ask for their parents or legal guardians’ consent to participate in the study.
+ For the intervention schools:
Healthy meal promotion program in students
Student Recruitment Letter
Dear Parent/Guardian,
In partnership between the University of Georgia School of Public Health and [Student’s school name], we are conducting a healthy meal promotion program, and we would like to invite your child to participate.
In this program, students will participate in healthy diet educational curricular, group discussions, counseling sections one a week over 20 weeks. Students are also heard stories and experience from living role model of the school about their healthily eating habits. Students will have an opportunity to choose healthy breakfast or lunch prepared by the school’s food services in additional to the regular meals. Students will take four assessment tests: at one week before the intervention program, at the end of the intervention program, 6 months and 12 months after the intervention program ending. All information obtained will be treated confidentially. If you would like to let your child to participate in this program, please sign this form below.
Your child is free to withdraw her/his participant at any time, should she/he becomes uncomfortable with it. Please call us at 706_______ or mail to healthymeal@uga.edu for any questions. We hope you will let your child enjoy this opportunity to promote healthy meal consumption. Thank you so much for your time and consideration.
Sincerely,
Healthy Meal Promotion Coordinator
The University of Georgia School of Public Health
+ For the control schools:
Healthy meal promotion program in students
Student Recruitment Letter
Dear Parent/Guardian,
In partnership between the University of Georgia School of Public Health and [Student’s school name], we are conducting a healthy meal promotion program, and we would like to invite your child to participate.
In this program, [Student’s school name] is assigned to be a control group. In control group, students do not receive any intervention from the program, which means there is no change in students’ regular curricular and activities. Students will take four assessment tests: at one week before the intervention program, at the end of the intervention program, 6 months and 12 months after the intervention program ending. All information obtained will be treated confidentially. If you would like to let your child to participate in this program, please sign this form below.
Your child is free to withdraw her/his participant at any time, should she/he becomes uncomfortable with it. Please call us at 706_______ or mail to healthymeal@uga.edu for any questions. We hope you will let your child enjoy this opportunity to share their experience and attitudes about healthy diets. Thank you so much for your time and consideration.
Sincerely,
Healthy Meal Promotion Coordinator
The University of Georgia School of Public Health
– Parent/Guardian’s Consent Form
Student name:___________________
Grade:
DOB:Parent/Legal guardian name:__________________________
Phone number:
Email address:Parent/Legal guardian signature:________________________
Date:_____________
Student Enrollment Form
School name: Student name Student’s grade Parent/Guardian name Phone number Email address Enrolled (Yes/No) Total Agree to enroll: Disagree to enroll:
- Attrition–Student Attendant FormSchool name:Group number: Number of students enrolled:Name coordinator/teacher: Name of activities:
Student Name Week Total # lessons participated 1 2 3 4 5 6 7 8 9 10 11 12 13 14 15 16 17 18 19 20 - Fidelity of the program
Criteria Percentage of satisfaction Problem happened (Y/N) Explanation <30% 30-50% 51-80% >80% Was the handbooks provided to every intervention student? Were all videos presented to students? Were all video presented in an appropriate time length (15 to 20 minutes)? Was the poster of the Food Guide Pyramid presented in every classroom, lunchroom, cafeteria? Was the photo of healthy food presented in every classroom, lunchroom, cafeteria? How many lessons were delivered to student during 20 weeks? The percentage of students participated in each lesson Week 1
Week2
Week 3
…
Week 20
How many quiz were tested? The percentage of students participated in each quiz + Quiz 1
+ Quiz 2
+ Quiz 3
+ Quiz 4
+ Quiz 5
Was 5-minute message delivered daily at lunch time during 20-week intervention? Percentage of living role model participated in the program (Target 3: 1 coach and 2 students)
References
Auld, G. W., Romaniello, C., Heimendinger, J., Hambidge, C., & Hambidge, M. (1998). Outcomes from a School-based Nutrition Education Program Using Resource Teachers and Cross-disciplinary Models. Journal of Nutrition Education, 30(5), 268-280. doi:http://dx.doi.org/10.1016/S0022-3182(98)70336-X
Auld, G. W., Romaniello, C., Heimendinger, J., Hambidge, C., & Hambidge, M. (1999). Outcomes from a School-based Nutrition Education Program Alternating Special Resource Teachers and Classroom Teachers. Journal of School Health, 69(10), 403.
Cohen, J. F., Kraak, V. I., Choumenkovitch, S. F., Hyatt, R. R., & Economos, C. D. (2014). The CHANGE study: a healthy-lifestyles intervention to improve rural children’s diet quality. J Acad Nutr Diet, 114(1), 48-53. doi:10.1016/j.jand.2013.08.014
COI. (2007). Children’s attitudes towards food: Omnibus Research Report Prepared for the Food Standard Agency Retrieved from http://dera.ioe.ac.uk/6787/1/childrensresearchfeb2007.pdf
Darmon, N., & Drewnowski, A. (2008). Does social class predict diet quality? Am J Clin Nutr, 87(5), 1107-1117.
Dubowitz, T., Heron, M., Bird, C. E., Lurie, N., Finch, B. K., Basurto-Davila, R., . . . Escarce, J. J. (2008). Neighborhood socioeconomic status and fruit and vegetable intake among whites, blacks, and Mexican Americans in the United States. Am J Clin Nutr, 87(6), 1883-1891.
Guerrero, A. D., Mao, C., Fuller, B., Bridges, M., Franke, T., & Kuo, A. A. (2016). Racial and Ethnic Disparities in Early Childhood Obesity: Growth Trajectories in Body Mass Index. J Racial Ethn Health Disparities, 3(1), 129-137. doi:10.1007/s40615-015-0122-y
Hoffman, J. A., Franko, D. L., Thompson, D. R., Power, T. J., & Stallings, V. A. (2010). Longitudinal behavioral effects of a school-based fruit and vegetable promotion program. J Pediatr Psychol, 35(1), 61-71. doi:10.1093/jpepsy/jsp041
Hunsberger, M., O’Malley, J., Block, T., & Norris, J. C. (2015). Relative validation of Block Kids Food Screener for dietary assessment in children and adolescents. Maternal & Child Nutrition, 11(2), 260-270. doi:10.1111/j.1740-8709.2012.00446.x
Puma, J., Romaniello, C., Crane, L., Scarbro, S., Belansky, E., & Marshall, J. A. (2013). Long-term student outcomes of the Integrated Nutrition and Physical Activity Program. J Nutr Educ Behav, 45(6), 635-642. doi:10.1016/j.jneb.2013.05.006
Satia, J. A. (2009). DIET-RELATED DISPARITIES: UNDERSTANDING THE PROBLEM AND ACCELERATING SOLUTIONS. J Am Diet Assoc, 109(4), 610-615. doi:10.1016/j.jada.2008.12.019