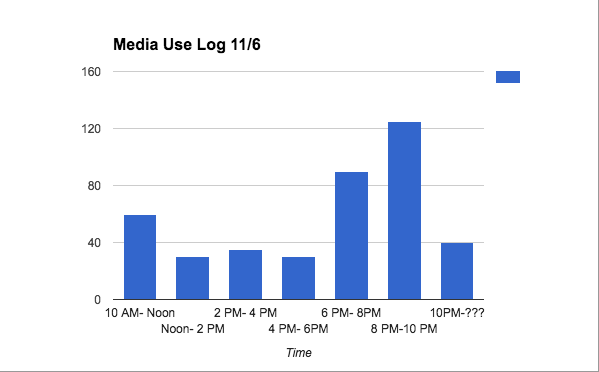
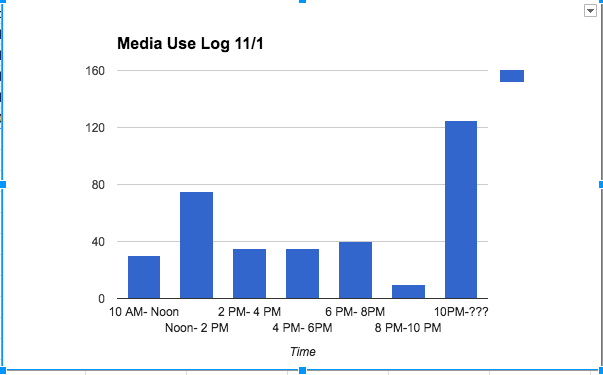
After my post last week about my media use, I became even more interested in how exactly I use media throughout the day. I have always known which form of media I use most often, my phone, and even more specific, which apps I use most. Since I already knew these things, I did not want to graph which media I spend the most time on, but instead how often I use media throughout the day. My media log gave me a visual of which forms of media I use for how long and for how often I use media, but it still was hard to compare the different times to each other. After graphing my weekend day and weekday, I really realized the differences between the two and how media use really varies depending on the day. On the weekday, I realized that when I am not in class, I am usually using some form of media for an extended period of time. I also realized that from 8-10 PM I don’t use a lot of media, but from 10 PM on is when I use the most media by over 40 min. My graph for my weekend day looked very different that the weekday graph. On the weekend, I use media a lot more than during the week, clearly because of how much more free time I have. On the weekend, I use the majority of my media after 6 PM, but less media at 10 PM on. Since I logged on a Sunday, the Patriots were playing so that explains why I logged so many minutes while they were playing! Overall, graphing the different days really made me realize how much media I use throughout the day, and also how much media I use at very specific times during the day.